

I've spent over 20 years inside the betting industry. I'll guide you to avoid the hype, ignore the noise, and steer clear of the common pitfalls that catch out everyday punters.
Attendance Report 2025
From the royal spectacle of Ascot to the roar of Cheltenham’s grandstands, millions pour through horse racing turnstiles each year. While online streaming and new betting sites have opened racing to a wider audience, the pull of being there in person remains stronger than ever.
Our analysis of a decade’s worth of attendance figures reveals the nation’s favourite racecourses.
Ascot has had over 5 million visitors in the last decade, making it the most-visited course in the UK

| Rank | Course | Average | Total |
|---|---|---|---|
1 | Ascot | 544,602 | 5,103,919 |
2 | Cheltenham | 438,076 | 4,368,832 |
3 | York | 295,726 | 2,855,031 |
4 | Newmarket | 289,892 | 2,758,082 |
5 | Chester | 220,343 | 2,089,306 |
6 | Goodwood | 205,866 | 2,018,250 |
7 | Doncaster | 194,457 | 1,896,608 |
8 | Aintree | 171,162 | 1,567,290 |
9 | Newbury | 154,751 | 1,510,110 |
10 | Haydock Park | 154,575 | 1,489,907 |
Ascot
- Total 10-year attendance - 5.10 million
- Average attendance per year - 544,602
With a staggering 5.10 million visitors over the last ten years and an annual average of 544,602, Ascot is the most popular racecourse by far. Its royal prestige and proximity to London undoubtedly add to its appeal, both with UK and international crowds.
This figure is 17% higher than the second-most popular UK racecourse, Cheltenham, showing how Ascot truly is leading the pack.
Cheltenham
- Total 10-year attendance - 4.37 million
- Average attendance per year - 438,076
Cheltenham follows close behind, attracting around 4.37 million visitors over the same period. This figure is equivalent to 438,076 spectators per year on average. As the home of the March Festival (jump racing’s biggest week), the course delivers some of the sport’s most atmospheric race days, helping it maintain one of the strongest followings in UK sport.
York
- Total 10-year attendance - 2.86 million
- Average attendance per year - 295,726
Though smaller in scale, York still attracted 2.86 million racegoers in the last decade, equal to around 295,726 per year. As one of the biggest courses in the north of England, it has a loyal regional following but also draws national attention each summer for the Ebor Festival.
Royal Ascot tops attendance figures for major festivals
While annual attendance shows which racecourses dominate overall, event-level figures reveal where the biggest spectacles really happen. From the royal tradition of Ascot to the once-a-year drama of the Grand National, these are the meetings that draw in the largest audiences.
| Rank | Meeting | Course | Av Daily Attendance 2022-25 | Total Attendance 2022-25 |
|---|---|---|---|---|
1 | Royal Ascot | Ascot | 54,984 | 1,099,677 |
2 | Cheltenham Festival | Cheltenham | 60,583 | 969,322 |
3 | Aintree Grand National | Aintree | 42,775 | 513,305 |
4 | Epsom Derby | Epsom Downs | 28,078 | 112,312 |
Royal Ascot Festival
- Average daily attendance (2022-2025) - 54,984
- Total attendance (2022-2025) - 1,099,677
Between 2022 and 2025, Royal Ascot welcomed an average of 54,984 fans per day, totalling more than 1.09 million across the period. Renowned for its royal pageantry and high standard of racing, the meeting remains a highlight of the British summer social calendar for many.
Premium enclosures often sell out months in advance, and this venue’s blend of tradition and glamour attracts all kinds of racing fans.
Cheltenham Festival
- Average daily attendance (2022-2025) - 60,583
- Total attendance (2022-2025) - 969,322
Even with fewer days, Cheltenham’s Festival has a higher daily average than many other events, with 60,583 people per day, around 10% higher than Ascot. Over the last four years, that amounts to 969,322 in total. The atmosphere of Prestbury Park makes this event a spectacle of National Hunt racing.
Aintree Grand National Festival
- Average daily attendance (2022-2025) - 42,775
- Total attendance (2022-2025) - 513,305
The Grand National remains one of the most famous horse races in the world, and Aintree’s figures prove it – 513,305 attendees in just four years, averaging 42,775 per day. Many travel specifically for the Saturday steeplechase, but demand for Thursday’s Ladies Day and Friday’s races continues to grow.
Ascot tickets are the highest in demand
| Rank | Course | UK '[racecourse]' tickets search |
|---|---|---|
1 | Ascot | 91,600 |
2 | Cheltenham | 17,450 |
3 | Aintree | 14,990 |
4 | Ayr | 11,860 |
5 | Newbury | 10,760 |
6 | Haydock Park | 10,580 |
7 | Cartmel | 9,450 |
8 | Uttoxeter | 8,900 |
9 | Wolverhampton | 8,560 |
10 | Doncaster | 8,500 |
Ascot
- 91.600 Annual Google searches for tickets
Headline events like Royal Ascot and QIPCO British Champions Day fuel Ascot’s ticket demand. Royal Ascot in particular is known for selling out premium enclosures months in advance, attracting not just racing fans but also fashion enthusiasts and corporate hospitality guests.
What’s more, interest in tickets for Ascot is five times higher than that of Cheltenham, showing just how popular the UK’s most-visited racing venue really is.
Cheltenham
- 17,450 Annual Google searches for tickets
Cheltenham’s ticket searches are heavily concentrated around the Cheltenham Festival each March. With four days of jump racing, completed by the Cheltenham Gold Cup, tickets for the best stands and hospitality areas often sell out well ahead of the event. The course’s role as the home of National Hunt racing keeps ticket searches high.
Aintree
- 14,990 Annual Google searches for tickets
Almost all of Aintree’s online ticket buzz stems from the Grand National Festival. As one of the most-watched horse races in the world, the Grand National routinely sells out, with demand spilling into the Thursday and Friday fixtures. The limited racing calendar at Aintree makes each meet feel unmissable.
Ticket demand for Bath Racecourse grows by over 200%
While Britain’s biggest courses dominate in absolute numbers, some smaller and mid-tier tracks are seeing the fastest growth in interest. Analysing year-on-year change in Google searches for “[racecourse] tickets” shows which venues are catching the public’s eye.
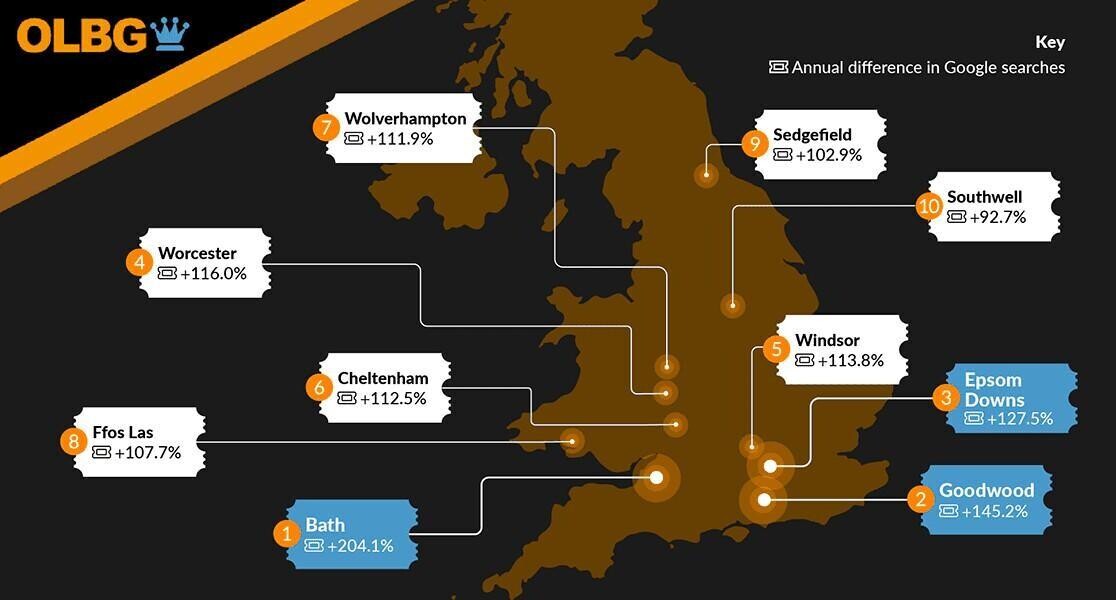
Bath
- 204.1% annual difference in Google searches
Bath’s search growth shows increasing interest in Somerset's only flat racing course. The themed race days and family-friendly atmosphere give the course a unique edge and have drawn in new crowds in recent years, boosting ticket demand dramatically.
Goodwood
- 145.2% annual difference in Google searches
Glorious Goodwood, the five-day flat racing festival, is famous for its scenic location just five miles north of Chichester. Popularity spikes each summer, and with limited hospitality and premium spots, many fans search early to secure a place.
Epsom Downs
- 127.5% annual difference in Google searches
The Derby Festival in early June is Epsom’s most popular, and the surge in searches indicates growing popularity for flat racing. With grandstand and hospitality tickets prone to selling out, especially for Derby Day, online demand has increased in the last year.
National Hunt racing has the highest average attendance figures
When we look at the most popular types of racing in the UK, it’s clear that jump racing is favoured. We analysed attendance by race type over the past decade and, while flat races remain popular, the data reveals that national hunt racing brings in larger crowds.
| Type | Average Attendance (2015-2025) |
|---|---|
Jump | 3,574 |
NH | 3,551 |
National Hunt
- Average attendance (2015-2025) - 3,574
Jump racing often occurs during the cooler months, but with high-profile events like the Cheltenham Festival, Grand National, and King George VI Chase, these meetings are the most popular on average.
Flat
- Average attendance (2015-2025) - 3,551
Flat racing averages slightly lower average attendance per fixture than jumps; however, it benefits from a packed summer schedule. Crowds peak during festivals like Royal Ascot and Glorious Goodwood, offsetting quieter weekday meetings.
Flat racing brings in the largest audience
| Type | Total attendance (2015-2025) |
|---|---|
Flat | 30,524,604 |
NH | 19,001,833 |
Flat
- Total attendance (2015-2025) - 30.5 million
Flat racing wins significantly when it comes to total attendance over the decade, thanks to a longer season stretching from spring to autumn. Major multi-day festivals and sunny summer conditions encourage higher turnout, with the sport’s glamour and fashion element attracting more casual fans.
National Hunt
- Total attendance (2015-2025) - 19.0 million
Jump racing’s shorter season still brings in large audiences, especially at marquee events. Cheltenham and Aintree alone account for a significant slice of total attendance, proving that quality fixtures can attract crowds.
June is the most popular month for racing events
Attendance figures from the past decade show a clear seasonal pattern: summer dominates the racing calendar, with warm weather and major flat festivals driving the highest crowds of the year.

June
- Total attendance (2015-2024) - 7.18 million
June is racing’s biggest month, largely due to Royal Ascot and the Derby Festival taking place at this time. Long daylight hours and warm weather make it ideal for outdoor events, boosting attendance year after year.
July
- Total attendance (2015-2024) - 6.73 million
In the peak of summer, July’s calendar features highlights like the Coral-Eclipse at Sandown and the King George VI and Queen Elizabeth Stakes at Ascot. It’s also the ideal time for casual day-trippers to visit the local courses.
August
- Total attendance (2015-2024) - 6.52 million
The Ebor Festival at York is one of the biggest racing events in August, drawing among the largest flat racing crowds of the year. The holiday season also means more families and tourists can go to midweek meetings, keeping attendance numbers high for this month.
Race spectating peaks in summer
| Season | Total Attendance (2015-2024) |
|---|---|
Spring | 12.26m |
Summer | 20.43m |
Autumn | 8.97m |
Winter | 5.50m |
Summer
- Total attendance (2015-2024) - 20.43 million
Summer brings good weather, and the high-profile flat festivals that take place during the season come alongside the highest turnout of the year. Royal Ascot, Glorious Goodwood, and York’s Ebor Festival, among many others, ensure unbeaten attendance figures.
Spring
- Total attendance (2015-2024) - 12.26 million
Spring benefits from jump racing’s grand finale at Cheltenham and Aintree, and the flat season’s opening meetings. The crossover appeal brings passionate crowds before the summer racing events take over.
Autumn
- Total attendance (2015-2024) - 8.97 million
While attendance figures are lower, autumn is still packed with racing events, from the St Leger Festival in September to QIPCO British Champions Day in October. Cooler weather and fewer daylight hours slightly reduce numbers, but the racing remains top-class.
Over 95% of racing fixtures go ahead each year
Across the past five years, UK horse racing has proven itself as one of the country’s most weather-resilient sports. Despite the challenges of heavy rain, frozen ground, and even extreme summer heat, more than 95% of scheduled fixtures have taken place every year.
| Year | Fixtures Programmed | Fixtures Rab | % |
|---|---|---|---|
2020 | 1,035 | 1,015 | 98.1% |
2021 | 1,486 | 1,436 | 96.6% |
2022 | 1,488 | 1,446 | 97.2% |
2023 | 1,488 | 1,425 | 95.8% |
2024 | 1,468 | 1,409 | 96.0% |
Between 2020 and 2024, more than 95% of scheduled fixtures took place each year. Even during 2020, when pandemic restrictions disrupted most sports, racing achieved its highest completion rate at 98.1%.
Small fluctuations were seen in the following years, reaching 96.6% in 2021, 97.2% in 2022, a small decline to 95.8% in 2023, and a rebound to 96.0% last year.
This consistency reflects the work of many racecourses to manage unexpected weather and maintain safe conditions so that spectators and participants can enjoy the races as planned. For fans, that means planning a trip to the races is far less of a gamble than with many other outdoor sports.
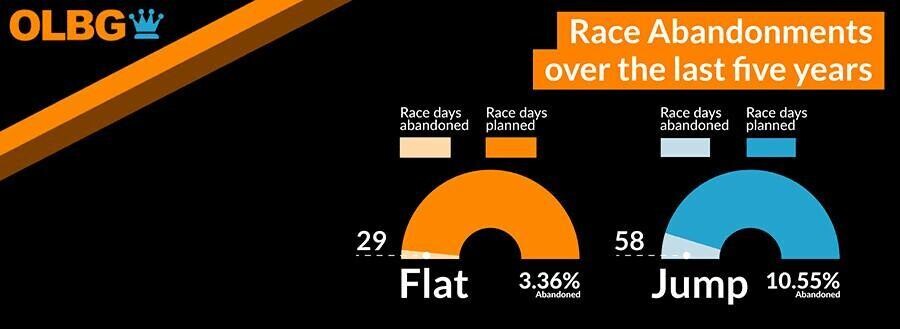
Abandonments fell to just 59 in 2024
| Year | Abandonments |
|---|---|
2020 | 67 |
2021 | 95 |
2022 | 75 |
2023 | 106 |
2024 | 59 |
While the completion rate remains high, some fixtures inevitably get cancelled. Heavy rainfall, frozen ground, waterlogged tracks, or extreme heat can force abandonments, prioritising the welfare of horses, jockeys, and spectators.
2024 was the smoothest year in the period, with just 59 cancelled meetings. This suggests both a milder climate and ongoing investment in drainage systems and track maintenance.
Methodology
1. Racecourse Attendance Data (2015–2025)
We gathered annual attendance figures for each UK racecourse from 2015 to 2025 from: https://www.hblb.org.uk/attendance. excluding 2020 and 2021 due to attendances being affected by COVID restrictions.
We then calculated an average annual attendance per racecourse over the decade.
2. Major Event Attendance
We collected individual attendance figures for headline events (Royal Ascot, Cheltenham Festival, Aintree Grand National, Epsom Derby, etc.) for the last 4 years (2022–2025) from the same source.
3. Attendance by Race Type
We then also took the total and average attendance for each type of racecourse annually.
4. Monthly & Seasonal Trends
We then calculated monthly and seasonal total attendances for each racecourse.
5. Search Data
Using Google Keyword Planner, we found the number of UK searches for the following terms across the last 4 years.
- [venue] racecourse tickets
- [venue] race tickets
We took the total for each and also calculated the year-on-year change.
6. Fixtures & Abandonments
We collected the number of fixture numbers and abandonments over the past 5 years from https://www.britishhorseracing.com/regulation/reports-and-statistics/racing-statistics/
Attendance Report 2024

*Excluding 2020-21
1. Ascot
Total 10-year attendance - 4.87 million
Average attendance per year - 583,204
Over the past decade, Ascot has been the most visited racecourse, with just under 600,000 visitors to races there each year. Several reasons could contribute to this - some sporting and some geography-related. Firstly, Ascot is located close to the capital city of London and even closer to the major airport of Heathrow, making it very accessible for visitors. Also, the course, which has been used for racing since 1711, is one of the most prestigious in the country, hosting the most significant events and enjoying a long-standing association with the Royal Family.
2. Cheltenham
Total 10-year attendance - 4.09 million
Average attendance per year - 458,096
Cheltenham is a racecourse located in the town of the same name in Gloucestershire, south-west England. It is one of the country’s oldest and most prestigious racecourses, hosting massive events such as the Cheltenham Festival in March and other big races throughout the year. The average attendance over the past ten years is over 450,000 per year and has increased during that time, making it the only racecourse in the top ten most popular to do this.
3. York
Total 10-year attendance - 2.83 million
Average attendance per year - 329,596
York is the third most attended racecourse in the past ten years, averaging just under 330,000 annually and almost 3 million over the decade. Unlike the two more popular racecourses, York only hosts flat races, making it the most visited flat racing racecourse.
Racecourses with the biggest attendances per event
| Rank | Racecourse | Overall Attendance 2023 | Number of Race Days | Average Attendance per Race Day | Average Attendance per Month |
|---|---|---|---|---|---|
| 1 | CHELTENHAM | 435,072 | 16 | 27,192 | 36,256 |
| 2 | ASCOT | 514,208 | 26 | 19,777 | 42,851 |
| 3 | AINTREE | 177,619 | 9 | 19,735 | 14,802 |
| 4 | YORK | 289,972 | 18 | 16,110 | 24,164 |
| 5 | CHESTER | 189,883 | 15 | 12,659 | 15,824 |
| 6 | GOODWOOD | 223,332 | 19 | 11,754 | 18,611 |
| 7 | CARTMEL | 68,579 | 9 | 7,620 | 5,715 |
| 8 | EPSOM DOWNS | 68,743 | 11 | 6,249 | 5,729 |
| 9 | NEWMARKET | 243,599 | 39 | 6,246 | 20,300 |
| 10 | DONCASTER | 167,301 | 37 | 4,522 | 13,942 |
| 11 | HAYDOCK PARK | 140,800 | 32 | 4,400 | 11,733 |
| 12 | NEWBURY | 129,835 | 30 | 4,328 | 10,820 |
| 13 | PONTEFRACT | 62,512 | 16 | 3,907 | 5,209 |
| 14 | BEVERLEY | 76,944 | 20 | 3,847 | 6,412 |
| 15 | RIPON | 63,110 | 17 | 3,712 | 5,259 |
| 16 | UTTOXETER | 87,853 | 24 | 3,661 | 7,321 |
| 17 | THIRSK | 51,236 | 16 | 3,202 | 4,270 |
| 18 | PERTH | 45,695 | 15 | 3,046 | 3,808 |
| 19 | WINDSOR | 77,573 | 26 | 2,984 | 6,464 |
| 20 | SANDOWN PARK | 98,006 | 34 | 2,883 | 8,167 |
| 21 | SALISBURY | 43,742 | 16 | 2,734 | 3,645 |
| 22 | HAMILTON PARK | 51,369 | 19 | 2,704 | 4,281 |
| 23 | MARKET RASEN | 57,323 | 23 | 2,492 | 4,777 |
| 24 | STRATFORD-ON-AVON | 40,460 | 17 | 2,380 | 3,372 |
| 25 | BANGOR-ON-DEE | 33,019 | 14 | 2,359 | 2,752 |
| 26 | CHEPSTOW | 67,412 | 29 | 2,325 | 5,618 |
| 27 | AYR | 78,178 | 34 | 2,299 | 6,515 |
| 28 | PLUMPTON | 38,271 | 17 | 2,251 | 3,189 |
| 29 | MUSSELBURGH | 60,113 | 27 | 2,226 | 5,009 |
| 30 | WARWICK | 42,190 | 19 | 2,221 | 3,516 |
| 31 | BATH | 48,351 | 22 | 2,198 | 4,029 |
| 32 | NEWTON ABBOT | 38,283 | 18 | 2,127 | 3,190 |
| 33 | WETHERBY | 41,358 | 20 | 2,068 | 3,447 |
| 34 | KELSO | 30,657 | 15 | 2,044 | 2,555 |
| 35 | YARMOUTH | 46,921 | 23 | 2,040 | 3,910 |
| 36 | REDCAR | 33,717 | 17 | 1,983 | 2,810 |
| 37 | WINCANTON | 31,199 | 18 | 1,733 | 2,600 |
| 38 | FAKENHAM | 22,165 | 13 | 1,705 | 1,847 |
| 39 | LUDLOW | 26,803 | 16 | 1,675 | 2,234 |
| 40 | FONTWELL PARK | 36,092 | 22 | 1,641 | 3,008 |
| 41 | TAUNTON | 22,403 | 14 | 1,600 | 1,867 |
| 42 | EXETER | 27,988 | 18 | 1,555 | 2,332 |
| 43 | WORCESTER | 31,334 | 21 | 1,492 | 2,611 |
| 44 | CATTERICK BRIDGE | 37,898 | 27 | 1,404 | 3,158 |
| 45 | HUNTINGDON | 27,712 | 20 | 1,386 | 2,309 |
| 46 | CARLISLE | 32,807 | 24 | 1,367 | 2,734 |
| 47 | HEXHAM | 21,852 | 16 | 1,366 | 1,821 |
| 48 | NEWCASTLE | 104,906 | 77 | 1,362 | 8,742 |
| 49 | NOTTINGHAM | 29,254 | 23 | 1,272 | 2,438 |
| 50 | LINGFIELD PARK | 91,683 | 77 | 1,191 | 7,640 |
| 51 | BRIGHTON | 24,226 | 21 | 1,154 | 2,019 |
| 52 | LEICESTER | 33,260 | 30 | 1,109 | 2,772 |
| 53 | KEMPTON PARK | 74,926 | 69 | 1,086 | 6,244 |
| 54 | HEREFORD | 16,194 | 15 | 1,080 | 1,350 |
| 55 | CHELMSFORD CITY | 48,082 | 48 | 1,002 | 4,007 |
| 56 | FFOS LAS | 26,932 | 27 | 997 | 2,244 |
| 57 | SEDGEFIELD | 13,701 | 14 | 979 | 1,142 |
| 58 | SOUTHWELL | 47,103 | 71 | 663 | 3,925 |
| 59 | WOLVERHAMPTON | 54,100 | 86 | 629 | 4,508 |
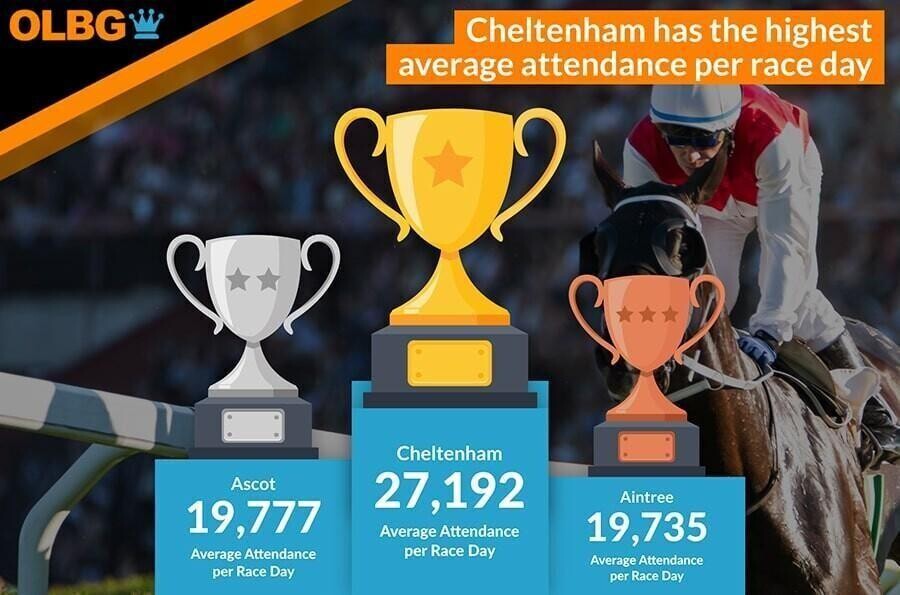
1. Cheltenham
2023 total attendance - 435,072
2023 number of race days - 16
Average attendance per race day - 27,192
In the past year of horse racing, Cheltenham had the highest average attendance per day of racing. Despite having around 80,000 fewer visitors annually than Ascot, it hosts ten fewer races and has around 8,000 more visitors per race on average. Some of the biggest races hosted at Cheltenham include the Champion Hurdle and the Gold Cup, both of which are contested at the Cheltenham Festival in March.
2. Ascot
2023 total attendance - 514,208
2023 number of race days - 26
Average attendance per race day - 19,777
As well as having the highest overall attendance, Ascot has the second-highest average attendance per race day. In 2023, there were 26 race days at the Ascot Racecourse, viewed by 514,208 fans, resulting in an average of just under 20,000 fans per race. Ascot’s most famous race meeting is the Royal Ascot Festival, Britain’s most valuable race meet, and later in the year, the most significant individual race takes place, the King George VI and Queen Elizabeth Stakes.
3. Aintree
2023 total attendance - 177,619
2023 number of race days - 9
Average attendance per race day - 19,735
Along with Cartmel in Cumbria, Aintree is one of only two racecourses that hosted fewer than ten meetings in 2023. However, only one race truly captures the imagination: the Grand National, one of the world's most iconic and prestigious races. The Grand National is said to have transcended horse racing as it is a significant event in the cultural calendar of Britain, with many Brits making it the only race they watch or bet on during the year.
Racecourses increasing and decreasing in popularity

| Rank | Racecourse | Total Attendance 2014 | Total Attendance 2023 | 2014 - 2023 Attendance Change | 2014 -2023 Attendance Change (%) |
|---|---|---|---|---|---|
| 1 | WARWICK | 28,201 | 42,190 | 13,989 | 49.60% |
| 2 | PLUMPTON | 26,143 | 38,271 | 12,128 | 46.39% |
| 3 | NEWCASTLE | 83,009 | 104,906 | 21,897 | 26.38% |
| 4 | BANGOR-ON-DEE | 30,130 | 33,019 | 2,889 | 9.59% |
| 5 | LUDLOW | 24,703 | 26,803 | 2,100 | 8.50% |
| 6 | EXETER | 26,080 | 27,988 | 1,908 | 7.32% |
| 7 | CARTMEL | 64,703 | 68,579 | 3,876 | 5.99% |
| 8 | BATH | 47,609 | 48,351 | 742 | 1.56% |
| 9 | CHELTENHAM | 428,934 | 435,072 | 6,138 | 1.43% |
| 10 | GOODWOOD | 222,391 | 223,332 | 941 | 0.42% |
| 11 | KELSO | 31,187 | 30,657 | -530 | -1.70% |
| 12 | HAMILTON PARK | 52,948 | 51,369 | -1,579 | -2.98% |
| 13 | HEXHAM | 22,583 | 21,852 | -731 | -3.24% |
| 14 | MARKET RASEN | 60,206 | 57,323 | -2,883 | -4.79% |
| 15 | BEVERLEY | 81,012 | 76,944 | -4,068 | -5.02% |
| 16 | TAUNTON | 23,599 | 22,403 | -1,196 | -5.07% |
| 17 | THIRSK | 54,706 | 51,236 | -3,470 | -6.34% |
| 18 | PONTEFRACT | 67,748 | 62,512 | -5,236 | -7.73% |
| 19 | RIPON | 68,956 | 63,110 | -5,846 | -8.48% |
| 20 | NOTTINGHAM | 32,086 | 29,254 | -2,832 | -8.83% |
| 21 | FAKENHAM | 24,417 | 22,165 | -2,252 | -9.22% |
| 22 | LEICESTER | 36,712 | 33,260 | -3,452 | -9.40% |
| 23 | CHEPSTOW | 75,639 | 67,412 | -8,227 | -10.88% |
| 24 | MUSSELBURGH | 67,915 | 60,113 | -7,802 | -11.49% |
| 25 | AYR | 88,561 | 78,178 | -10,383 | -11.72% |
| 26 | AINTREE | 203,042 | 177,619 | -25,423 | -12.52% |
| 27 | YORK | 336,046 | 289,972 | -46,074 | -13.71% |
| 28 | WINDSOR | 90,062 | 77,573 | -12,489 | -13.87% |
| 29 | YARMOUTH | 54,565 | 46,921 | -7,644 | -14.01% |
| 30 | SOUTHWELL | 55,122 | 47,103 | -8,019 | -14.55% |
| 31 | ASCOT | 617,128 | 514,208 | -102,920 | -16.68% |
| 32 | CATTERICK BRIDGE | 45,500 | 37,898 | -7,602 | -16.71% |
| 33 | UTTOXETER | 105,767 | 87,853 | -17,914 | -16.94% |
| 34 | NEWTON ABBOT | 46,303 | 38,283 | -8,020 | -17.32% |
| 35 | SALISBURY | 52,969 | 43,742 | -9,227 | -17.42% |
| 36 | HAYDOCK PARK | 170,717 | 140,800 | -29,917 | -17.52% |
| 37 | HUNTINGDON | 33,887 | 27,712 | -6,175 | -18.22% |
| 38 | PERTH | 57,111 | 45,695 | -11,416 | -19.99% |
| 39 | STRATFORD-ON-AVON | 51,364 | 40,460 | -10,904 | -21.23% |
| 40 | WORCESTER | 41,115 | 31,334 | -9,781 | -23.79% |
| 41 | REDCAR | 44,271 | 33,717 | -10,554 | -23.84% |
| 42 | FONTWELL PARK | 49,968 | 36,092 | -13,876 | -27.77% |
| 43 | FFOS LAS | 37,513 | 26,932 | -10,581 | -28.21% |
| 44 | NEWMARKET | 339,886 | 243,599 | -96,287 | -28.33% |
| 45 | EPSOM DOWNS | 95,984 | 68,743 | -27,241 | -28.38% |
| 46 | SANDOWN PARK | 138,301 | 98,006 | -40,295 | -29.14% |
| 47 | WINCANTON | 44,586 | 31,199 | -13,387 | -30.03% |
| 48 | CHESTER | 279,671 | 189,883 | -89,788 | -32.10% |
| 49 | CARLISLE | 48,694 | 32,807 | -15,887 | -32.63% |
| 50 | NEWBURY | 196,458 | 129,835 | -66,623 | -33.91% |
| 51 | BRIGHTON | 36,682 | 24,226 | -12,456 | -33.96% |
| 52 | WOLVERHAMPTON | 82,590 | 54,100 | -28,490 | -34.50% |
| 53 | WETHERBY | 64,509 | 41,358 | -23,151 | -35.89% |
| 54 | LINGFIELD PARK | 144,949 | 91,683 | -53,266 | -36.75% |
| 55 | DONCASTER | 273,403 | 167,301 | -106,102 | -38.81% |
| 56 | SEDGEFIELD | 25,500 | 13,701 | -11,799 | -46.27% |
| 57 | KEMPTON PARK | 144,193 | 74,926 | -69,267 | -48.04% |
1. Warwick
2014 attendance - 28,201
2023 attendance - 42,190
Change - 49.6%
Sadly, racecourses have seen attendance drop by 17.25% on average, and only ten of the 57 in this study have seen attendance grow. Warwick Racecourse has seen the most significant increase in attendance, with numbers increasing by almost 50% from 28,201 in 2014 to 42,190 in 2024.
2. Plumpton
2014 attendance - 26,143
2023 attendance - 38,271
Change - 46.39%
Plumpton is a jump racing venue in East Sussex that attracted around 38,000 fans in 2023, a rise of over 46% from 2014 when just over 26,000 people were in attendance. The biggest race at the course is the Sussex National Handicap Chase.
3. Newcastle
2014 attendance - 83,009
2023 attendance - 104,906
Change - 26.38%
Newcastle Racecourse has seen the third-highest increase in its attendance since 2014. The course, which has been operating since 1882, had a revamp in 2016, with a new all-weather flat course introduced, which allowed more races to take place and attendance to increase.

| Rank | Racecourse | Total Attendance 2014 | 2014 - 2023 Attendance Change | 2014 -2023 Attendance Change (%) | 10 Year Attendance Change (%) |
|---|---|---|---|---|---|
| 1 | KEMPTON PARK | 144,193 | 74,926 | -69,267 | -48.04% |
| 2 | SEDGEFIELD | 25,500 | 13,701 | -11,799 | -46.27% |
| 3 | DONCASTER | 273,403 | 167,301 | -106,102 | -38.81% |
| 4 | LINGFIELD PARK | 144,949 | 91,683 | -53,266 | -36.75% |
| 5 | WETHERBY | 64,509 | 41,358 | -23,151 | -35.89% |
| 6 | WOLVERHAMPTON | 82,590 | 54,100 | -28,490 | -34.50% |
| 7 | BRIGHTON | 36,682 | 24,226 | -12,456 | -33.96% |
| 8 | NEWBURY | 196,458 | 129,835 | -66,623 | -33.91% |
| 9 | CARLISLE | 48,694 | 32,807 | -15,887 | -32.63% |
| 10 | CHESTER | 279,671 | 189,883 | -89,788 | -32.10% |
| 11 | WINCANTON | 44,586 | 31,199 | -13,387 | -30.03% |
| 12 | SANDOWN PARK | 138,301 | 98,006 | -40,295 | -29.14% |
| 13 | EPSOM DOWNS | 95,984 | 68,743 | -27,241 | -28.38% |
| 14 | NEWMARKET | 339,886 | 243,599 | -96,287 | -28.33% |
| 15 | FFOS LAS | 37,513 | 26,932 | -10,581 | -28.21% |
| 16 | FONTWELL PARK | 49,968 | 36,092 | -13,876 | -27.77% |
| 17 | REDCAR | 44,271 | 33,717 | -10,554 | -23.84% |
| 18 | WORCESTER | 41,115 | 31,334 | -9,781 | -23.79% |
| 19 | STRATFORD-ON-AVON | 51,364 | 40,460 | -10,904 | -21.23% |
| 20 | PERTH | 57,111 | 45,695 | -11,416 | -19.99% |
| 21 | HUNTINGDON | 33,887 | 27,712 | -6,175 | -18.22% |
| 22 | HAYDOCK PARK | 170,717 | 140,800 | -29,917 | -17.52% |
| 23 | SALISBURY | 52,969 | 43,742 | -9,227 | -17.42% |
| 24 | NEWTON ABBOT | 46,303 | 38,283 | -8,020 | -17.32% |
| 25 | UTTOXETER | 105,767 | 87,853 | -17,914 | -16.94% |
| 26 | CATTERICK BRIDGE | 45,500 | 37,898 | -7,602 | -16.71% |
| 27 | ASCOT | 617,128 | 514,208 | -102,920 | -16.68% |
| 28 | SOUTHWELL | 55,122 | 47,103 | -8,019 | -14.55% |
| 29 | YARMOUTH | 54,565 | 46,921 | -7,644 | -14.01% |
| 30 | WINDSOR | 90,062 | 77,573 | -12,489 | -13.87% |
| 31 | YORK | 336,046 | 289,972 | -46,074 | -13.71% |
| 32 | AINTREE | 203,042 | 177,619 | -25,423 | -12.52% |
| 33 | AYR | 88,561 | 78,178 | -10,383 | -11.72% |
| 34 | MUSSELBURGH | 67,915 | 60,113 | -7,802 | -11.49% |
| 35 | CHEPSTOW | 75,639 | 67,412 | -8,227 | -10.88% |
| 36 | LEICESTER | 36,712 | 33,260 | -3,452 | -9.40% |
| 37 | FAKENHAM | 24,417 | 22,165 | -2,252 | -9.22% |
| 38 | NOTTINGHAM | 32,086 | 29,254 | -2,832 | -8.83% |
| 39 | RIPON | 68,956 | 63,110 | -5,846 | -8.48% |
| 40 | PONTEFRACT | 67,748 | 62,512 | -5,236 | -7.73% |
| 41 | THIRSK | 54,706 | 51,236 | -3,470 | -6.34% |
| 42 | TAUNTON | 23,599 | 22,403 | -1,196 | -5.07% |
| 43 | BEVERLEY | 81,012 | 76,944 | -4,068 | -5.02% |
| 44 | MARKET RASEN | 60,206 | 57,323 | -2,883 | -4.79% |
| 45 | HEXHAM | 22,583 | 21,852 | -731 | -3.24% |
| 46 | HAMILTON PARK | 52,948 | 51,369 | -1,579 | -2.98% |
| 47 | KELSO | 31,187 | 30,657 | -530 | -1.70% |
| 48 | GOODWOOD | 222,391 | 223,332 | 941 | 0.42% |
| 49 | CHELTENHAM | 428,934 | 435,072 | 6,138 | 1.43% |
| 50 | BATH | 47,609 | 48,351 | 742 | 1.56% |
| 51 | CARTMEL | 64,703 | 68,579 | 3,876 | 5.99% |
| 52 | EXETER | 26,080 | 27,988 | 1,908 | 7.32% |
| 53 | LUDLOW | 24,703 | 26,803 | 2,100 | 8.50% |
| 54 | BANGOR-ON-DEE | 30,130 | 33,019 | 2,889 | 9.59% |
| 55 | NEWCASTLE | 83,009 | 104,906 | 21,897 | 26.38% |
| 56 | PLUMPTON | 26,143 | 38,271 | 12,128 | 46.39% |
| 57 | WARWICK | 28,201 | 42,190 | 13,989 | 49.60% |
1.Kempton Park
2014 attendance - 144,193
2023 attendance - 74,926
Change - -48.94%
At the other end of the spectrum is Kempton Park Racecourse in Surrey, located in a park of the same name. The course is home to the King George VI Chase, which takes place on Boxing Day every year. Unfortunately, numbers have almost halved at Kempton Park since 2014, dropping from 144,193 to just 74,926 in 2023.
2. Sedgefield
2014 attendance - 25,500
2023 attendance - 13,701
Change - -46.27%
While Newcastle racecourse has increased its attendance, Sedgefield, in the neighbouring County Durham, has seen a dramatic fall in the number of fans visiting. In 2023, there were 13,701 fans, over 10,000 fewer than in 2014, when there were 25,500.
3. Doncaster
2014 attendance - 273,403
2023 attendance - 167,301
Change - -38.81%
Doncaster is one of the biggest and most famous racecourses in the country and is home to the world-famous St Leger Stakes race, which takes place in September. In 2014, Doncaster was the sixth most attended racecourse in the country, with almost 275,000 fans in attendance, but in 2023, it was only the eighth most popular, with just over 167,000 fans.
Which racecourses do people really want to visit?
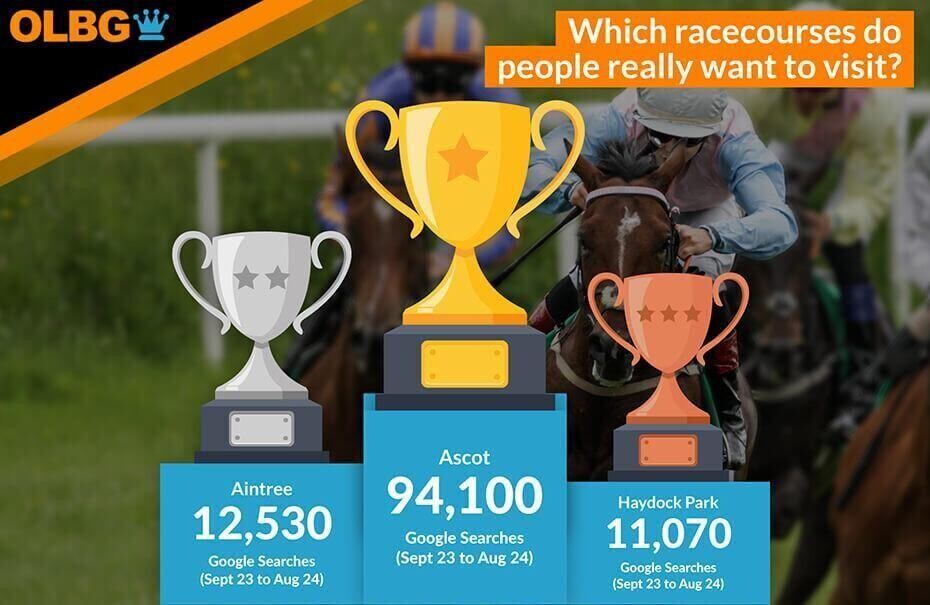
| Rank | Racecourse | Number of Google Searches (SEP 23 to AUG 24) |
|---|---|---|
| 1 | ASCOT | 94,100 |
| 2 | AINTREE | 12,530 |
| 3 | HAYDOCK PARK | 11,070 |
| 4 | CHELTENHAM | 9,820 |
| 5 | NEWBURY | 8,670 |
| 6 | AYR | 8,280 |
| 7 | NEWMARKET | 7,020 |
| 8 | CARTMEL | 6,490 |
| 9 | DONCASTER | 6,220 |
| 10 | CHESTER | 6,040 |
| 11 | YORK | 5,810 |
| 12 | MUSSELBURGH | 5,640 |
| 13 | WARWICK | 5,630 |
| 14 | WOLVERHAMPTON | 4,410 |
| 15 | CHEPSTOW | 4,320 |
| 16 | LINGFIELD PARK | 4,220 |
| 17 | SEDGEFIELD | 4,040 |
| 18 | NEWCASTLE | 3,610 |
| 19 | PERTH | 3,370 |
| 20 | KEMPTON PARK | 3,160 |
| 21 | GOODWOOD | 2,700 |
| 21 | NEWTON ABBOT | 2,700 |
| 23 | STRATFORD-ON-AVON | 2,680 |
| 24 | MARKET RASEN | 2,480 |
| 25 | PLUMPTON | 2,330 |
| 26 | THIRSK | 2,250 |
| 27 | SANDOWN PARK | 2,220 |
| 28 | PONTEFRACT | 2,210 |
| 28 | WORCESTER | 2,210 |
| 30 | BRIGHTON | 2,160 |
| 31 | BEVERLEY | 2,150 |
| 32 | WETHERBY | 2,080 |
| 33 | HUNTINGDON | 2,050 |
| 34 | KELSO | 1,840 |
| 35 | LEICESTER | 1,820 |
| 36 | SALISBURY | 1,790 |
| 37 | HEXHAM | 1,700 |
| 38 | EXETER | 1,690 |
| 39 | HAMILTON PARK | 1,680 |
| 40 | FFOS LAS | 1,570 |
| 41 | BATH | 1,540 |
| 42 | WINDSOR | 1,530 |
| 43 | CHELMSFORD CITY | 1,350 |
| 44 | FONTWELL PARK | 1,330 |
| 45 | SOUTHWELL | 1,320 |
| 46 | FAKENHAM | 1,300 |
| 47 | CARLISLE | 1,280 |
| 48 | EPSOM DOWNS | 1,270 |
| 49 | NOTTINGHAM | 1,250 |
| 50 | WINCANTON | 1,090 |
| 51 | BANGOR-ON-DEE | 800 |
| 52 | HEREFORD | 710 |
| 53 | REDCAR | 580 |
| 54 | RIPON | 440 |
| 55 | LUDLOW | 150 |
| 56 | UTTOXETER | 120 |
| 57 | CATTERICK BRIDGE | 00 |
| 57 | TAUNTON | 00 |
| 57 | YARMOUTH | 00 |
1.Ascot, 94,100 annual Google searches:
Perhaps unsurprisingly, given that it is the most attended racecourse, Ascot has the most Google searches by people searching for tickets by a country mile. At just under 100,000, there are over 80,000 more searches for Ascot tickets than any other course.
2. Aintree, 12,530 annual Google searches:
Aintree Racecourse has the second-highest number of searches, with around 12,500 people searching for racecourse tickets there. However, the actual Grand National race, which takes place there, has a higher number, as it is better known than the racecourse it is run on.
3. Haydock Park, 11,070 annual Google searches:
Another racecourse near Liverpool is the third most searched-for racecourse by those looking for tickets. Haydock Park Racecourse tickets were searched just over 11,000 times in the past year.
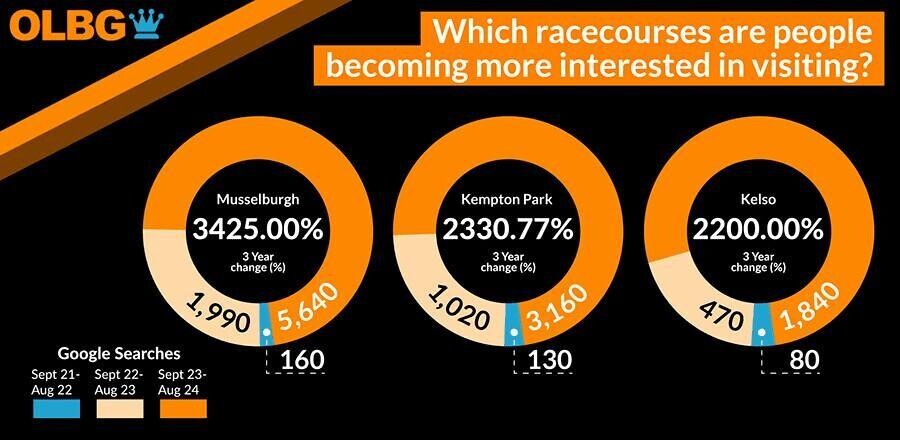
Which racecourses are people becoming more interested in visiting?
| Rank | Racecourse | Number of Google Searches (SEP 21 to AUG 22) | Number of Google Searches (SEP 22 to AUG 23) | 21/22 to 22/23 Change | Number of Google Searches (SEP 23 to AUG 24) | 22/23 to 23/24 Change | 3 Year Search Change |
|---|---|---|---|---|---|---|---|
| 1 | MUSSELBURGH | 160 | 1,990 | 1143.75% | 5,640 | 183.42% | 3425.00% |
| 2 | KEMPTON PARK | 130 | 1,020 | 684.62% | 3,160 | 209.80% | 2330.77% |
| 3 | KELSO | 80 | 470 | 487.50% | 1,840 | 291.49% | 2200.00% |
| 4 | HAMILTON PARK | 80 | 2,050 | 2462.50% | 1,680 | -18.05% | 2000.00% |
| 5 | MARKET RASEN | 120 | 1,160 | 866.67% | 2,480 | 113.79% | 1966.67% |
| 6 | CARTMEL | 320 | 2,880 | 800.00% | 6,490 | 125.35% | 1928.13% |
| 7 | PONTEFRACT | 110 | 260 | 136.36% | 2,210 | 750.00% | 1909.09% |
| 8 | STRATFORD-ON-AVON | 170 | 490 | 188.24% | 2,680 | 446.94% | 1476.47% |
| 9 | FFOS LAS | 100 | 290 | 190.00% | 1,570 | 441.38% | 1470.00% |
| 10 | BEVERLEY | 140 | 360 | 157.14% | 2,150 | 497.22% | 1435.71% |
| 11 | SALISBURY | 130 | 2,190 | 1584.62% | 1,790 | -18.26% | 1276.92% |
| 12 | WORCESTER | 180 | 950 | 427.78% | 2,210 | 132.63% | 1127.78% |
| 13 | FAKENHAM | 120 | 250 | 108.33% | 1,300 | 420.00% | 983.33% |
| 14 | HUNTINGDON | 190 | 620 | 226.32% | 2,050 | 230.65% | 978.95% |
| 15 | CHELMSFORD CITY | 130 | 810 | 523.08% | 1,350 | 66.67% | 938.46% |
| 16 | SANDOWN PARK | 230 | 1,560 | 578.26% | 2,220 | 42.31% | 865.22% |
| 17 | GOODWOOD | 280 | 1,490 | 432.14% | 2,700 | 81.21% | 864.29% |
| 18 | WINDSOR | 160 | 230 | 43.75% | 1,530 | 565.22% | 856.25% |
| 19 | CARLISLE | 150 | 900 | 500.00% | 1,280 | 42.22% | 753.33% |
| 20 | NEWTON ABBOT | 350 | 2,400 | 585.71% | 2,700 | 12.50% | 671.43% |
| 21 | NEWBURY | 1,250 | 3,680 | 194.40% | 8,670 | 135.60% | 593.60% |
| 22 | THIRSK | 330 | 630 | 90.91% | 2,250 | 257.14% | 581.82% |
| 23 | WINCANTON | 160 | 240 | 50.00% | 1,090 | 354.17% | 581.25% |
| 24 | HEREFORD | 110 | 170 | 54.55% | 710 | 317.65% | 545.45% |
| 25 | EXETER | 280 | 640 | 128.57% | 1,690 | 164.06% | 503.57% |
| 26 | NOTTINGHAM | 210 | 960 | 357.14% | 1,250 | 30.21% | 495.24% |
| 27 | CHESTER | 1,020 | 5,430 | 432.35% | 6,040 | 11.23% | 492.16% |
| 28 | WOLVERHAMPTON | 820 | 1,580 | 92.68% | 4,410 | 179.11% | 437.80% |
| 29 | BRIGHTON | 410 | 1,160 | 182.93% | 2,160 | 86.21% | 426.83% |
| 30 | WARWICK | 1,080 | 2,360 | 118.52% | 5,630 | 138.56% | 421.30% |
| 31 | YORK | 1,140 | 3,840 | 236.84% | 5,810 | 51.30% | 409.65% |
| 32 | CHEPSTOW | 960 | 1,660 | 72.92% | 4,320 | 160.24% | 350.00% |
| 33 | LINGFIELD PARK | 1,010 | 1,550 | 53.47% | 4,220 | 172.26% | 317.82% |
| 34 | NEWCASTLE | 870 | 1,790 | 105.75% | 3,610 | 101.68% | 314.94% |
| 35 | WETHERBY | 550 | 810 | 47.27% | 2,080 | 156.79% | 278.18% |
| 36 | BATH | 410 | 840 | 104.88% | 1,540 | 83.33% | 275.61% |
| 37 | PLUMPTON | 750 | 990 | 32.00% | 2,330 | 135.35% | 210.67% |
| 38 | SEDGEFIELD | 1,400 | 2,570 | 83.57% | 4,040 | 57.20% | 188.57% |
| 39 | HAYDOCK PARK | 3,880 | 6,900 | 77.84% | 11,070 | 60.43% | 185.31% |
| 40 | CHELTENHAM | 3,560 | 3,330 | -6.46% | 9,820 | 194.89% | 175.84% |
| 41 | EPSOM DOWNS | 590 | 640 | 8.47% | 1,270 | 98.44% | 115.25% |
| 42 | DONCASTER | 3,280 | 2,810 | -14.33% | 6,220 | 121.35% | 89.63% |
| 43 | REDCAR | 320 | 400 | 25.00% | 580 | 45.00% | 81.25% |
| 44 | AYR | 5,230 | 8,030 | 53.54% | 8,280 | 3.11% | 58.32% |
| 45 | PERTH | 2,440 | 4,030 | 65.16% | 3,370 | -16.38% | 38.11% |
| 46 | AINTREE | 9,120 | 10,050 | 10.20% | 12,530 | 24.68% | 37.39% |
| 47 | UTTOXETER | 90 | 120 | 33.33% | 120 | 0.00% | 33.33% |
| 48 | LEICESTER | 1,450 | 1,430 | -1.38% | 1,820 | 27.27% | 25.52% |
| 49 | ASCOT | 75,000 | 76,000 | 1.33% | 94,100 | 23.82% | 25.47% |
| 50 | LUDLOW | 150 | 120 | -20.00% | 150 | 25.00% | 0.00% |
| 51 | NEWMARKET | 7,420 | 7,380 | -0.54% | 7,020 | -4.88% | -5.39% |
1. Musselburgh
2021-2022 searches - 160
2023-2024 searches - 5,640
Increase - 3,425%
Musselburgh Racecourse (previously known as Edinburgh Racecourse) is referenced in the classic 1963 war movie, The Great Escape, in which one of the allied POW characters was a Scottish Jockey. Sixty years later, Musselburgh is increasing in popularity, as searches have risen dramatically in the past three years.
2. Kempton Park
2021-2022 searches - 130
2023-2024 searches - 1,020
Increase - 2,331%
Perhaps surprisingly, given that actual attendances have dwindled dramatically in the past decade at Kempton Park, it is the racecourse with the second-highest increase in ticket searches.
3. Kelso
2021-2022 searches - 80
2023-2024 searches - 1,840
Increase - 2,200%
Another Scottish racecourse completes the top three, as Kelso has also seen a rise of just over 2,000% in total Google searches. Located in southern Scotland, just over the border from England, it is easy for fans from both nations to attend.
Flat Racing vs Jump Racing - what are the attendance differences?

The attendance figures show that flat and jump racing are almost identical in popularity. Although there were over 30 million total attendees over the past ten years for flat races, compared to just under 20 million for jump races, there are far fewer jump race fixtures.
| Race Type | 2023 Attendance | Number of Race Days | Average Attendance per Race Day |
|---|---|---|---|
| Flat | 2,966,956 | 920 | 3,225 |
| Jump | 1,863,881 | 597 | 3,122 |
| Difference | 1,103,075 | 323 | 3.19% |
For instance, in 2023, the average attendance at flat races was 3,225 per race day, compared to 3,122 at jump races. This constitutes a slightly higher average attendance for flat races, 3.19%, to be precise.
Race abandonments
In the past year, a far more jump race dyas were abandoned than flat race days, around 9% more. This is slightly higher than the average difference over the past five years, which is closer to 7% more abandonments in jump-race days.
A major reason for this is that jump races tend to take place in the winter and spring, whereas flat races are most prominent in summer. The weather is usually drier and fairer in summer, allowing better conditions for successful racing.

Author Commentary
“The racing industry has faced many battles in the past decade to get attendees through the gates in the UK, and like many other sports, the Covid-19 Pandemic provided even more difficult circumstances to contend with in 2020 and 2021.
“It’s even been mentioned in several press outlets recently that a potential smoking ban in the UK could be a further deterrent to turn people away from going to racing events, and with such questions in mind, how deep should we be looking into UK horse racing attendance trends?
The team at OLBG are proud to be involved in the UK racing trade, and as part of our latest Racing Attendance Report, we wanted to compare and contrast attendance figures over the past 10 years per racecourse, seasonally, and per race type.
‘Ascot ranks as the most visited racecourse over the past decade with just under 600,000 race visitors each year, and with Royal Ascot registering as one of the most esteemed events in the racing calendar, interest in this racecourse comes as no surprise; 94,100 Google searches were made relating to Ascot between September 2023 and August 2024.
‘The numbers of attendees at major UK racecourses always see a major boost due to headline festival events, but it is paramount we highlight some of the courses that people are becoming more aware of and interested in visiting. Musselburgh is one of those, and over the past three years, search numbers for the racecourse have increased by more than 3,000%!
Methodology
Total attendances for racecourses over the past ten years were sourced from https://www.hblb.org.uk/attendance. We then calculated the average attendance per year. (2020 and 2021 figures were excluded from the calculation as lockdowns caused by the COVID-19 pandemic dramatically impacted them.)
We also calculated the average monthly attendance and the average attendance per race day by dividing the total attendance in 2023 by the number of races that took place, sourced from HBLB.
We also discovered the total attendance for flat and jump races during the ten years and in 2023. We then calculated the average attendance per race day for each race type.
Google Keyword Planner was used to find total searches for visiting each race track on Google. We found the total number of searches for ‘ venue racecourse tickets’ between September 2023 and August 2024.


