With hundreds of different betting sites, finding the best can be confusing. I'll guide you through and find the most suitable bookie for you.
If there is one element in English football that has created continual debate over the decades, it is the measure of success. A measure that is rather simple on the face of it, but perhaps a little complex when you scratch the surface.
Although taking a pure count of trophies earned is the accepted way to measure success, it has a habit of leaving out a whole range of context and although a team may have won a glut of silverware thirty or so years ago, does that really hold the same value as trophies in the modern era?
This means we may have to start looking at things a little differently and in doing so, we can go some way to settling this age-old debate once and for all. While with this in mind, it is also the perfect environment for our latest data-driven deep dive.

All Time Premier League Points Table
Here we are not only going to measure trophies won, but we are also going to apply a certain weight to each cup and in addition to this, we are going to apply a ratio that decreases the further back in history we go.
In doing this, each team that has won a trophy since English football began, will subsequently earn themselves ranking points and once these are all calculated, a final and absolute league table will be in place.
THE MATHEMATICS
While the way to do this, is to take 100 trophy tokens and split them across six separate competitions – the top division in English football, the FA Cup and League Cup from a domestic point of view and any English winners of European club competition*
Competition denoted as European Cup/Champions League, UEFA Cup/Europa League, European Cup Winners’ Cup
A split that looks as follows:
| Competition | Weight |
|---|---|
| League Champions | 35 |
| Champions League Winners | 25 |
| FA Cup Winners | 15 |
| League Cup Winners | 10 |
| UEFA Cup Winners | 10 |
| Cup Winners' Cup Winners | 5 |
WHAT DOES THIS MEAN?
In this process we will treat all trophy wins as equal. Therefore, Tottenham’s 1981 FA Cup success has a value of one and so does Manchester City’s successful defence of the Premier League last season.
However, once we attach the trophy weight to these wins, things start to differ. With Manchester City’s success being as league champions, it is multiplied by 35 and with Tottenham’s glory coming in the FA Cup, theirs is multiplied by 15.
THE WEIGHT OF HISTORY
Now we could stop at this juncture and just add all the successes together to get our final scores. However, we also need to apply something that we will label ‘history tax’ – the further the trophy was won in the past, the less value it holds.
For example, if we use Manchester City’s same Premier League victory of 2024 as a benchmark. It would be one trophy win (1) times its weight in trophy tokens (35), multiplied by another one due to it being a recent success.
Therefore, Pep Guardiola and his men earned the Etihad outfit 35 trophy points in the overall league table at the end of last season. However, this ratio decreases every 10 years by 0.1 and if we used the same method for Chelsea’s Premier League win of 2009/10, it would only be worth 31.5.
Here we take Chelsea’s one trophy win (1) times its weight in trophy tokens (35) multiplied by a ratio of 0.9 (history tax added) to add 31.5 to the Stamford Bridge points total.
While to make things clearer, here is each of the ratios and the date ranges in which they are active:
| Date Range | Ratio |
|---|---|
| 2015/16 to Present | 1 |
| 2005/06 to 2014/15 | 0.9 |
| 1995/96 to 2004/05 | 0.8 |
| 1985/86 to 1994/95 | 0.7 |
| 1975/76 to 1984/85 | 0.6 |
| 1965/66 to 1974/75 | 0.5 |
| 1955/56 to 1964/65 | 0.4 |
| 1945/46 to 1954/55 | 0.3 |
| 1935/36 to 1944/45 | 0.2 |
| 1925/26 to 1934/45 | 0.1 |
| 1900/01 to 1924/25 | 0.05 |
| 1872/83 to 1899/00 | 0.01 |
Now that we know the calculation behind all this success (trophy win x trophy weight x history tax) we are very close to unveiling the results. However, before we show our calculated league table, we will provide some important context.
A context that comes courtesy of the all-time table – one that is ranked on all wins being equal as any other and with that in mind, here is the Top 10 of this measure:
| Club | Top League | FA Cup | League Cup | Champions League | Cup Winners Cup | UEFA Cup | Total |
|---|---|---|---|---|---|---|---|
| Liverpool | 20 | 8 | 10 | 6 | 0 | 3 | 47 |
| Manchester United | 20 | 13 | 6 | 3 | 1 | 1 | 44 |
| Arsenal | 13 | 14 | 2 | 0 | 1 | 0 | 30 |
| Manchester City | 10 | 7 | 8 | 1 | 1 | 0 | 27 |
| Chelsea | 6 | 8 | 5 | 2 | 3 | 2 | 26 |
| Aston Villa | 7 | 7 | 5 | 1 | 0 | 0 | 20 |
| Tottenham Hotspur | 2 | 8 | 4 | 0 | 1 | 3 | 18 |
| Everton | 9 | 5 | 0 | 0 | 1 | 0 | 15 |
| Newcastle United | 4 | 6 | 1 | 0 | 0 | 0 | 11 |
| Blackburn Rovers | 3 | 6 | 1 | 0 | 0 | 0 | 10 |
It’s great news if you are a Liverpool fan, as the Merseyside men have won a total of 47 major trophies (apologies to any fans of the European Super Cup, World Club Cup or Community Shield, as they have not been added to the total count).
While Liverpool’s recent success under Jurgen Klopp and now Arne Slot has seen them usurp one of their nearest rivals and with Manchester United only refilling the trophy cabinet with the 2024 edition of the FA Cup, then find themselves second with 44.

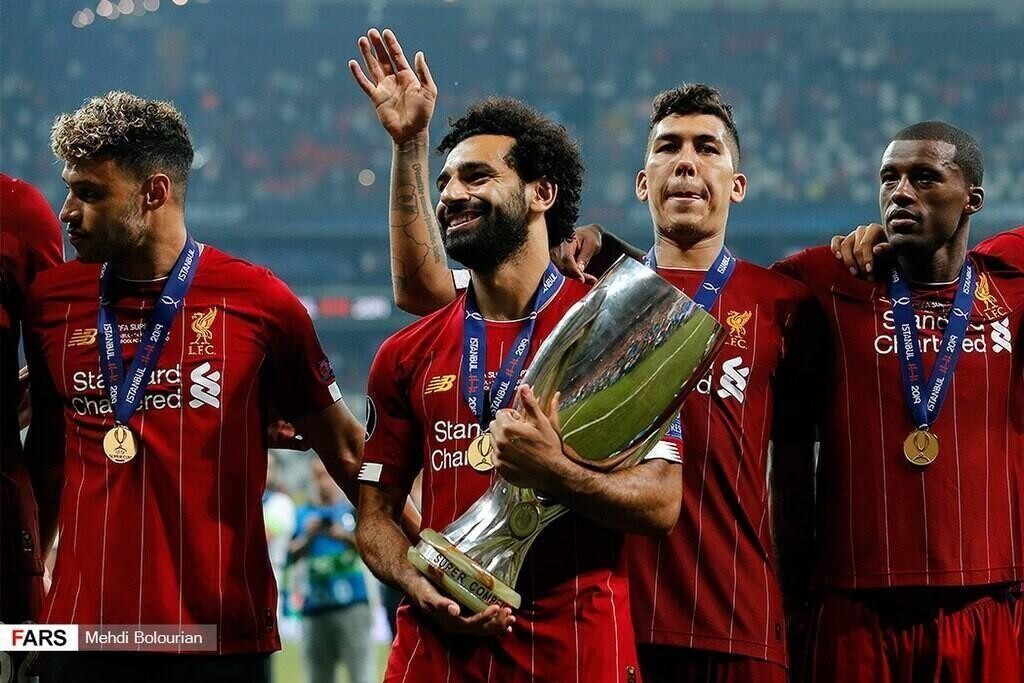
Fars Media Corporation, CC BY 4.0 , via Wikimedia Commons
As for Arsenal, they are currently third with 30 overall trophies to their name and with nearly half of those being the FA Cup, it is fair to say that they have a certain affinity with the best cup competition in the world.
Their tally of 30 is three more than that of Manchester City, who after their Premier League title success of 2024/25 are now one clear of Chelsea with 26 (thanks to their recent Europa Conference League success). Although the logical progression of the big six stops there, as Aston Villa gate-crash the party with 20 trophies wins to their name.

Premier League Average Positions - Who Are The Real Big 6
That is at the expense of Tottenham who are on 18 who recently picked up the Europa League and ended their 17-year trophy drought and they are being chased by Everton 15 who will now look to add to that tally now that they have the keys to their new home.
Rounding out the top 10 are Newcastle who landed their 11th overall trophy thanks to Carabao Cup success in March and this now takes them one clear in Blackburn.
THE WAIT IS OVER
Now we know how things look in terms of an equal measure, we can also see how they compare when using our mathematical formula and once again, we are going to highlight the top 10 teams in English football history:
| Club | Top League | FA Cup | League Cup | Champions League | Cup Winners Cup | UEFA Cup | Total |
|---|---|---|---|---|---|---|---|
| Manchester United | 448 | 125.25 | 54 | 55 | 3.5 | 10 | 695.75 |
| Liverpool | 357 | 85.5 | 76 | 105 | 0 | 19 | 642.5 |
| Manchester City | 297.5 | 59.25 | 70 | 25 | 2.5 | 0 | 454.25 |
| Chelsea | 168 | 100.5 | 38 | 47.5 | 11.5 | 19 | 384.5 |
| Arsenal | 192.5 | 141 | 14 | 0 | 3.5 | 0 | 351 |
| Everton | 93.1 | 29.25 | 0 | 0 | 3 | 0 | 125.35 |
| Tottenham Hotspur | 24.5 | 49.5 | 27 | 0 | 2 | 11 | 114 |
| Nottingham Forest | 21 | 6.15 | 26 | 30 | 0 | 0 | 83.15 |
| Aston Villa | 24.5 | 8.7 | 30 | 15 | 0 | 0 | 78.2 |
| Leeds United | 59.5 | 7.5 | 5 | 0 | 0 | 0 | 72 |
While this time it is good news for Manchester United supporters, as their flurry of 13 Premier League titles under Sir Alex Ferguson have managed to score higher when Liverpool’s overall and more historic collection of 20 league championships.
Even though the Red Devils were beaten by their Merseyside rivals in three cup competitions, joint success in both top flight and a greater return in the FA Cup means that United earned a total of 695.75 calculated trophy points.
In comparison to this, Liverpool have only managed to earn 642.5 for their troubles but with Arne Slot already delivering silverware to Anfield in the form of the Premier League, that gap could be closed in the next couple of years.
While Manchester City’s recent success has seen them move up to third in the table of all-time success. The Etihad outfit certainly have some history to fall back on and their success at Maine Road should not be ignored. However, it is the last decade which has thrust them up the standings.
Their dominance in England has seen them surge past Chelsea, as the fourth-place Stamford Bridge outfit are just 33.5 points clear of Arsenal in fifth and 69.75 points behind Pep Guardiola’s cabal of superstars at Manchester City.

Oldelpaso, CC BY-SA 3.0 , via Wikimedia Commons
With only 103.25 calculated trophy points separating the trio, third in this table is very much for grabs and although there is little margin between the three teams positioned between third and fifth, they are a substantial distance clear of Everton in sixth.
SIX TO TEN
Although Everton have not won a major trophy since the 1995 FA Cup, they were no slouches in the decades before then and because of their success during yesteryear, their total of 125.35 points sees them move up two places when compared to the trophy count.
Then again, just like there is little difference between Manchester City, Chelsea and Arsenal, the same could be said between Everton and Tottenham and although they have done reasonably well in the cup competitions, their lack of league titles has largely been their undoing.
However, it is history that has given Nottingham Forest something of a substantial boost and even though they were outside the top 10 in the trophy count table, the quality of trophies won sees them earn 83.15 calculated trophy points overall.
A tally that comes courtesy of two European Cups across 1979 and 1980 and a First Division title in 1978. Add in a few League Cups for good measure and Brian Clough can take pride in making the City Ground side the eighth most successful in England.

Russ Hamer, CC BY-SA 3.0 , via Wikimedia Commons
Of course, Aston Villa have also conquered Europe and with their European Cup success coming back in 1982, it was worth 15 calculated trophy points – a contribution that goes towards 78.2 in total, which is just 4.95 less than that of Nottingham Forest.
Rounding off the top 10 is none other than Leeds United and with their glory days largely coming in the 1970’s – not to mention a First Division title under Howard Wilkinson in 1992, they have also improved their ranking when compared to overall trophy counts.
CONCLUSION
One thing to consider is that this method of calculation is not absolute and if the weights were different when applied to trophy wins, we may have got different results. However, this method does perhaps iron out all the kinks when it comes to comparing a win in the 90’s to the 70’s.
It is not perfect but if anything, it has added more fuel to the fire and for those Liverpool and Manchester United fans, the debate as to who is the most successful club in English football, is one that will only continue further.
Methodology
Data correct as of 17th June 2025. Methodology created by article author.


