


Premier League Table
How to Read an OLBG Premier League Tip
Alongside the match details, you can see specific Premier League betting tips from our knowledgeable Premier League tipsters. The selection odds are shown with the overall confidence rating for each EPL tip.
The confidence % rating looks at the total number of tips on the relevant Premier League betting market; for example, Full Time Result tips reflect the number of picks for home, away and draw selections.
A higher confidence rating than the odds for the relevant Premier League tips is a good indication of a possible value bet. The Value Rating is 1 to 5 stars, with 5 being the best.
Our Premier League tipsters cover predictions on a wide selection of markets, including 1X2, over/under goals (Total Goals), both teams to score (BTTS), First Goalscorer, Correct Score and many more.
Some tipsters are experts in finding great bets from certain markets; they have studied all the Premier League stats and trends, so the research is already done before they place their Premier League betting tips.
Click on an EPL match prediction above to dig deeper into the Premier League tips available. You will now see all the selections placed on the various Premier League betting markets.
At the top of the page is a percentage breakdown of the most popular tip on the Full Time Result market. You will also see the Best Tipster's Tip, which is the selection on this match from the Premier League tipster with the best profit for football tips covering the last 12 months.
On the match tips page, you can also check out the profitability of a Premier League tipster before deciding to follow their tip. Analyse their profit performance over the last seven days, thirty days and annual profit for football tips, plus their consistency for regularly tipping winners.
Check out the Premier League Tipster table to view the best-performing football tipsters for profit on Premier League tips covering the last month, 6 months and 12 months.
How to Win from Betting the EPL
As well as providing Premier League tips for today's and upcoming matches, OLBG's Premier League tipsters also provide in-depth analysis to help you understand why they are selecting their Premier League Betting Tips and thus help you hopefully benefit from your Premier League bets.
Our Premier League Betting Forum has in-depth, expert topics such as your Premier League betting approach, how to build tissues (the odds for each match), how Poisson Distribution can help with your Premier League betting tips and much more.
As well as the more in-depth statistical discussion, our EPL betting experts also discuss the latest transfers, injuries, team tactics and their assessments on how this affects their Premier League predictions.
Our Premier League Betting Blogs area is packed full of articles, again looking at all the betting angles for the EPL. These are in-depth statistical articles to help you spot the best trends and angles to look out for with your Premier League tips.
Some cover topics which perhaps are not widely used when making Premier League tips, for example, we look at Which Premier League Team Travels The Most as that may impact a team's performance in the match, next game and over the season as a whole.
We also have an extensive range of blogs covering the Premier League manager merry-go-round, with articles on all the Premier League teams, plus a general look at the Next Premier League Manager To Be Sacked odds.
The 'new manager' effect tends to have an impact on teams playing their next game under a new boss, a factor a Premier League tipster would be foolish not to consider before making their Premier League tips.
Which Bookies Offer the Best Odds
If you pick your bets on our Premier League predictions page, you can click on the 'add' option next to the Premier League tips you like, and they will be added to your betslip.
You can add as many selections as you wish, and then, if you are betting singles or an accumulator, check which bookie has the best odds for your EPL bets by viewing the odds comparison table at the top of the page.
In our article covering the Best Football Bookmakers, we look at the Premier League betting odds provided by all the top UK bookmakers to see if any bookie regularly offers the best odds on the Premier League.
There is research to suggest that BetVictor is one of the best football betting sites, as they regularly provide good odds on Premier League matches, and they back that up with their price promise for football accumulators.
Another fairly new type of bet introduced in recent times, which is proving to be very popular with football bettors and Premier League tipsters, is the Request A Bet, where you can build your own bet on a live Premier League match, for example.
You can select from many events to happen in the match, for instance, a player to be booked or sent off, a player to have many shots on target or to score from a header or free-kick.
This adds a new dimension to Premier League betting and football betting in general, as it gives football bettors a new way of betting, adding further excitement when watching the live Premier League football on television.
Do check out our free bets and promotions pages and the offers listed by the matches on-site and in our app.
All bookies regularly provide great enhanced odds offers and other specials on their Premier League betting markets, so it's best to keep up to date and see if there is a bookie you do not bet with currently who may enhance your Premier League football betting experience.
History of the League
The English Premier League is the top tier of English football and consists of the best 20 teams in the country, who play 38 games home and away.
The season is played from August through to May, with the three teams at the bottom of the table after those 38 games being relegated. These teams are then replaced by 3 teams from the Championship, the champions and runner-ups and then the winner of the Championship playoffs.
The top four Premier League clubs qualify for the UEFA Champions League. In recent seasons, England has also earned a fifth Champions League place through UEFA's coefficient-based European Performance Spot - awarded to the fifth-placed side when English clubs collectively perform well in Europe the previous season, though it's reassessed each year rather than guaranteed.
A Europa League place then goes to the next-highest finisher plus the FA Cup winner, while the Carabao Cup winner enters the Conference League. Cup and European-trophy winners who have already qualified via the league can push these places one spot further down the table.
More bets are placed on EPL matches than any other League in the world, with over 200 live markets for every match from a range of EPL bookies.
The most popular are the 1x2 markets, over/under 2.5 goals, and correct score predictions. The bookies compete with each other to offer the best odds, knowing the number of customers whose first search is for Premier League Betting odds.
You will find huge variations between the best and worst odds, which can make a big difference to your returns, especially when it comes to EPL Accumulator bets.
You can create your own football accas using the My Acca tool; the selections are from the best free daily football tips from OLBG's best-performing football tipsters.
Betting Tips on outright markets and individual matches are placed throughout the season, with, if anything, who will be relegated, rather than who will win the EPL, creating way more betting interest.
Since its inception in 1992 and up to the 2025-26 Premier League season, there have been 51 clubs participating in the EPL. Luton were the nearest when appearing in the 2023-24 season.
Only six clubs have the honour of being ever-present in the Premier League, and those are Arsenal, Chelsea, Everton, Liverpool, Manchester United and Tottenham Hotspur, which have played in every EPL season.
For more information on the latest news and Premier League fixtures, consult the official Premier League site, and for the latest Premier League results, you can also check out the BBC Premier League results page.
Premier League Trends
To help with your England Premier League tips and bets, the following 5-year England Premier League statistics may be useful.
| 2021-22 | 2022-23 | 2023-24 | 2024-25 | 2025-26 | |
|---|---|---|---|---|---|
| Home Wins | 163 (43%) | 184 (48%) | 175 (46%) | 155 (41%) | 162 (43%) |
| Draws | 88 (23%) | 87 (23%) | 82 (22%) | 93 (24%) | 104 (27%) |
| Away Wins | 129 (34%) | 109 (29%) | 123 (32%) | 132 (35%) | 114 (30%) |
| BTTS (Yes) | 190 (50%) | 196 (52%) | 234 (62%) | 218 (57%) | 213 (56%) |
| Over 2.5 Goals | 205 (54%) | 200 (53%) | 246 (65%) | 215 (57%) | 209 (55%) |
| Goals Per Game | 2.82 | 2.85 | 3.28 | 2.93 | 2.75 |
Correct Scores
The top 5 most occurring Correct Scores over the past five seasons:
- 1-1 = 210 (11% or 8/1)
- 2-1 = 160 (8% or 11/1)
- 1-0 = 156 (8% or 11/1)
- 0-1 = 129 (7% or 13/1)
- 2-0 = 128 (7% or 13/1)
Cards & Corners
How many EPL Yellow Cards?
Below you can see how many yellow cards have been dished out to the home and away sides over the past five seasons of the EPL and the average number of yellow cards shown per game.
We have also produced a Yellow Card Betting Odds & Historical Statistics article, which delves a little deeper into the Premier League teams and players' disciplinary records, plus the EPL referees' card counts.
| Season | Yellows (APG) | Most Yellows |
|---|---|---|
| 2025-26 | 1,424 (3.75) | Tottenham (99) |
| 2024-25 | 1,549 (4.08) | Chelsea (99) |
| 2023-24 | 1,602 (4.22) | Chelsea (105) |
| 2022-23 | 1,375 (3.62) | Leeds, Nottm Forest & Wolves (84) |
| 2021-22 | 1,299 (3.42) | Leeds (101) |
How many EPL Red Cards?
Below, just like the yellow card statistics, you can find the statistics for the number of red cards which have been issued over the past five seasons in the EPL.
| Season | Reds | Most Reds |
|---|---|---|
| 2025-26 | 44 | Chelsea (8) |
| 2024-25 | 52 | Arsenal (6) |
| 2023-24 | 58 | Burnley (7) |
| 2022-23 | 31 | Wolves (6) |
| 2021-22 | 46 | Everton (6) |
Which Referee Produces the Most Cards?
Stuart Attwell was the referee during the 2025-26 season to issue, on average, the most yellow cards per match, with an average of 4.60 in the 25 matches he officiated.
Top Five Card Distributing Refs (10+ games)
- Stuart Attwell (25 Games, 115 Yellows (4.60), 3 Reds)
- Michael Salisbury (13 Games, 57 Yellows (4.38), 0 Reds)
- Darren England (23 Games, 99 Yellows (4.30), 3 Reds)
- Robert Jones (18 Games, 75 Yellows (4.17), 0 Reds)
- Chris Kavanagh (30 Games, 122 Yellows (4.07), 4 Reds)
Check out our Men In The Middle article, which takes a more detailed look at the Premier League referees and their booking stats.
EPL Corner Statistics
Below you can find the corner statistics for the last five seasons of the EPL. It is no surprise to see the top clubs topping the lists.
| Season | Corners (APG) | Most Corners |
|---|---|---|
| 2025-26 | 3,799 (10.00) | Liverpool (257) |
| 2024-25 | 3,890 (10.24) | Man City (253) |
| 2023-24 | 4,111 (10.80) | Liverpool (287) |
| 2022-23 | 3,830 (10.08) | Newcastle (270) |
| 2021-22 | 3,953 (10.40) | Man City (316) |
Past Winners of the Premier League
Manchester United dominated the Premier League in the early years and won the last of their 13 titles in the 2012-13 season, whilst Manchester City has won four of the last six titles.
Liverpool finished runners-up in the 2018-19 season with 97 points, a total which would have won the Premier League every season from inception in 1992-93 through to the 2016-17 season.
Last Ten Premier League Champions
| Season | Champions | Runners-Up |
|---|---|---|
| 2025-26 | Arsenal (85 Pts) | Manchester City (78 Pts) |
| 2024-25 | Liverpool (84 Pts) | Arsenal (74 Pts) |
| 2023-24 | Manchester City (91 Pts) | Arsenal (89 Pts) |
| 2022-23 | Manchester City (89 Pts) | Arsenal (84 Pts) |
| 2021-22 | Manchester City (93 Pts) | Liverpool (92 Pts) |
| 2020-21 | Manchester City (86 Pts) | Manchester United (74 Pts) |
| 2019-20 | Liverpool (99 Pts) | Manchester City (81 Pts) |
| 2018-19 | Manchester City (98Pts) | Liverpool (97 Pts) |
| 2017-18 | Manchester City (100 Pts) | Manchester United (81 Pts) |
| 2016-17 | Chelsea (93 Pts) | Tottenham (86 Pts) |
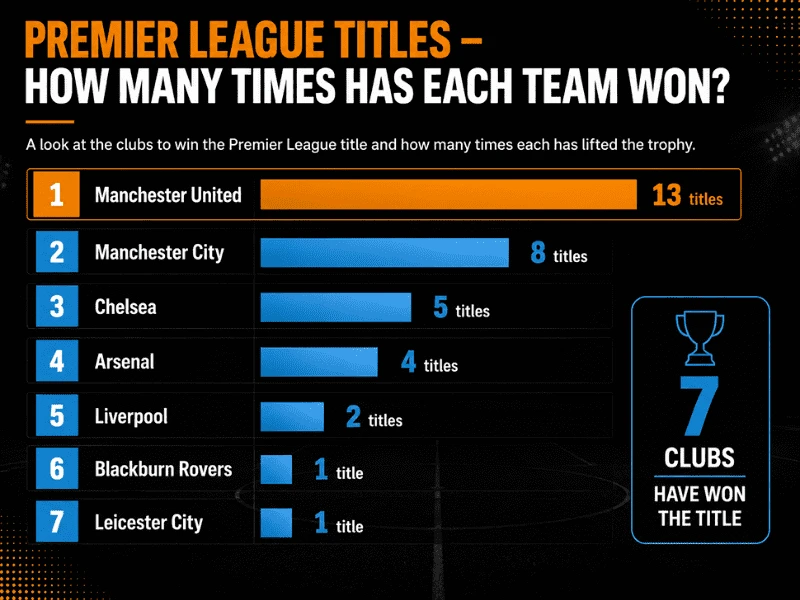
How many times each team has won the Title?
Seven different clubs have won the title since the inception of the Premier League in the early 1990s; Liverpool are the most recent club to join the winners' list.
Manchester United lead the way with thirteen titles to their name; they are some five titles clear of the local rivals Manchester City, who are on eight wins. Having said that, United's last title was way back in 2013, as they have struggled to replicate the challenge since Sir Alex left.
The two London clubs have combined for nine titles, five of those for Chelsea and four for Arsenal, who ended their long wait in the 2025-26 season, having last won it in 2004. Liverpool then has two titles, which came in 2020 and 2025.
Then it is a single title to Blackburn, who won their title in the 3rd season of the Premier League, and who can forget Leicester's title win in 2016 when they were priced up by the bookies at 5000/1 before the start of the season.
Records, Stats and Milestones
Top All-Time Appearances
A title-winning season for James Milner in 2019-20 was also a season in which he moved into the top 5 for EPL appearances, and then gradually moved up the list in each following season and then during the 2025-26 season, moved to the top of the list as the player with the most appearances in the EPL.
- James Milner 658
- Gareth Barry 653
- Ryan Giggs 632
- Frank Lampard 609
- David James 572
Top All-Time Goalscorers
Following thirty goals during the 2022-23 season, Harry Kane jumped up the list from fifth to second and is now only 47 goals behind the leader, Alan Shearer.
After finishing his final season with Liverpool in the 2024-25 season, Mo Salah moved up to 4th on the list.
- Alan Shearer 260
- Harry Kane 213
- Wayne Rooney 208
- Mo Salah 193
- Andrew Cole 187
Check out our Golden Boot Betting Odds article on the likely contenders for the Premier League's Top Goalscorer accolade. A Premier League tipster will have the nucleus of obvious candidates to hand, like Erling Haaland, when looking to forecast their EPL Golden Boot tips for the season.
Records in the Premier League
- Most goals scored in an EPL season: 2017-18 Manchester City (106)
- Most points in an EPL season: 2017-18 Manchester City (100)
- Fewest points in an EPL season: 2007-08 Derby County (11)
- The biggest win in an EPL season: 9-0 has been achieved three times, Man Utd 9-0 Ipswich (1995), Southampton 0-9 Leicester (2019) & Man Utd 9-0 Southampton (2021).
- The highest attendance for a single EPL game: 2017-18 Season: Wembley 83,222, Tottenham Hotspur 1–0 Arsenal.
There is a lot of talk among fans and the general public about footballers' earnings. Many think that footballers are overpaid, but what about those who don't even play?
Our research showed the top-earning players by minutes on the pitch, showing their earnings from the bench, with some very costly reserve keepers to note.
OLBG's Premier League expert Andy Powell brings a wealth of knowledge and experience to provide insightful content for the English top flight. His deep understanding of the game, coupled with his passion for Premier League football, ensures that his content is always informative, engaging, and accurate.

Andy Powell
Expert Guide
All statistics and information on this page are maintained and reviewed by Andy Powell and were correct at the time of the last update.
FAQ
Premier League Football Tips FAQs
-
Get the best Premier League betting tips for today for free right here on this page from OLBG's army of expert Premier League tipsters. The most popular Premier League betting tips are listed at the top of the page; these are the selections receiving the most picks from OLBG's knowledgeable football predictors. The Premier League tips depicted with a crown icon indicate an OLBG football expert has also made this prediction; experts are designated by a high strike rate, current profit and 6-monthly profit for football tips.
-
The top tips for Premier League betting are right here on OLBG courtesy of our army of knowledgeable football bettors. The Premier League betting selections are well-researched, considering current form, team news and all relevant stats and facts a Premier League tipster would be expected to know when providing their top tips for Premier League betting.
-
Our army of knowledgeable Premier League tipsters does all the hard work for you, analysing recent Premier League form and keeping track of the latest team news and injuries to bring you the best Premier League tips for free. The best Premier League tipster currently shows the highest level stakes profit for Premier League football tips in the OLBG Premier League Tipster Competitions over the last 12 months.
-
Get the best free overall Premier League predictions here from OLBG's knowledgeable Premier League tipsters. They provide pre-season analysis with their season-long Premier League predictions for the upcoming EPL title race. A Premier League tipster will have their eyes firmly fixed on the summer transfer market for any major moves to enhance the leading contenders' squads before deciding on their Premier League predictions.
-
Check the season-long Premier League betting tips from OLBG's knowledgeable Premier League tipsters to see who their Premier League favourites are this season. Man City are popular with the bookies in their Premier League betting odds before the season starts. OLBG's Premier League tipsters may unearth potential title winners this season for you. Man United, Liverpool, Tottenham, Arsenal and Chelsea may be popular picks to rival the Premier League favourites.
-
Get the best free Premier League predictions from OLBG's knowledgeable Premier League tipsters. Here you will find season-long predictions for the Premier League title race in addition to the Premier League match tips throughout the season. The Premier League teams receiving the most picks from our Premier League tipsters for the EPL title race are those worth close consideration for the top 5 teams in the Premier League come the end of the season.