With hundreds of different betting sites, finding the best can be confusing. I'll guide you through and find the most suitable bookie for you.
How do Bookmakers Work
Bookmakers or Bookies take money on a number of different outcomes on an event and then pay money out to those who predicted the result of the event correctly whilst keep a little edge for themselves.
This article is going to cover everything about how bookmakers work.
What do bookmakers do? - A bookmaker is a business that offers the option for people to make financial bets on a range of events, primarily sport, predicting outcomes.
They will offer betting odds on the chosen outcome which can be accepted and a bet placed.
They keep the money from losing bets and pay winners on correct predictions.
This article will cover everything you need to know about understanding how bookmakers work, including:
| Section | Reading Time |
|---|---|
| How Bookmakers Work | 1 Minute |
| Betting Odds Explained | 10 Minutes |
| How do Bookies Make Money | 1 Minute |
| How Do Bookmakers Calculate Odds | 7 Minutes |
| Why Do Betting Odds Change | 5 Minutes |
| How to Be a Bookmaker | 3 Minutes |
How 1 Bookmaker Lost Over £1m on 1 Race
Watch Now
Knowing how bookmakers work involves understanding how they offer a range of prices on different outcomes, mostly around sport, but also other real-life events too.
Their aim is to keep a balanced book and ensure a profit at the end of the event regardless of the result.
Bookmakers do this by setting differing odds, including a margin, known as an over-round.
The entire business model of how a bookmaker works is based around the betting odds they offer. Arguably it is the most important factor in how a bookmaker creates, builds and maintains a business.
Betting odds are intrinsically linked to perceived probability and provided for the punter to ‘buy’, on this basis.
Understanding Odds is Key to Understanding Betting
For that reason, it is important for sports betting fans to understand betting odds like a bookmaker does. So let’s dive in
How Bookmakers Use Odds
So now we have bookies odds fully explained, let's go forward and find out how they use them.
Let's use a coin toss as an example
There are two possible outcomes where the true probability of either heads or tails is 50% in percentage terms,
This could be reflected in betting odds of Evens, or 2.00.
So how does the bookmaker set his book?
He will create an over-round by offering odds of less than evens.
In this example, 4/5 or 1.80
So if he were to take bets of £100 each on both heads and tails, a total of £200 in bets, whatever the outcome, he would pay out only £180 meaning a £20 profit for the bookmaker.
That's how bookmakers use betting odds!
Betting Odds Explained
The entire business of how a bookmaker works to create a business is based around offering odds for players to bet on, let's find out everything there is to know about betting odds.
What Are Betting Odds?
Outside of gambling, probability is more commonly referred to in percentage terms.
We saw in the coin toss example above how a bookmaker will set odds to his advantage, by offering less than evens chances to an event where there are equal, or 'even' chance of any outcome to ensure a profit on the book.
Let's take a look at an example with more than two possible outcomes, but again, each with an equal chance.
Example of probability with dice.
If you roll a 6 sided dice, there is a one in six chance of any one number coming up. This can be expressed by the probability of 16.66%.
The table below demonstrates the true probability, and how a bookmaker might price it up. Remember, there is an equal chance of all outcomes, and so the prices are the same which will differ if applied to a football match or a horse race
| Side | True % | True Odds | Bookie Odds | Bookie % |
|---|---|---|---|---|
| 1 | 16.66% | 6.00 | 5.50 | 18.2% |
| 2 | 16.66% | 6.00 | 5.50 | 18.2% |
| 3 | 16.66% | 6.00 | 5.50 | 18.2% |
| 4 | 16.66% | 6.00 | 5.50 | 18.2% |
| 5 | 16.66% | 6.00 | 5.50 | 18.2% |
| 6 | 16.66% | 6.00 | 5.50 | 18.2% |
| Total | 100% | 109.2% |
This example demonstrates how the bookmaker will take the non-profitable 100% book and add a margin by slightly lowering the prices to create a total of over 100% to create a 9.2% over-round on the book.
Understanding odds and getting the best odds available when betting is key to understanding how bookmakers work and helping you make a profit from betting in the long term.
Now let's take the same table, same dice and same equal chance and create a different table
| Side | True % | True Odds | Bookie Odds | Bookie % |
|---|---|---|---|---|
| 1 | 16.66% | 6.00 | 4.00 | 25% |
| 2 | 16.66% | 6.00 | 5.00 | 20% |
| 3 | 16.66% | 6.00 | 6.00 | 16.66% |
| 4 | 16.66% | 6.00 | 6.00 | 16.66% |
| 5 | 16.66% | 6.00 | 7.00 | 14.3% |
| 6 | 16.66% | 6.00 | 8.00 | 12.5% |
| Total | 100% | 105.62% |
In this book, you can see how the bookmaker has adjusted some prices up, and others down. The same scenario of an over-round (Over 100%) book has been produced to a level of 5.62% in the bookies favour.
If these six possible outcomes were horses, with jockeys, on a soft track with hurdles, going left-handed in inclement weather and with different handicap marks, you can see how much more difficult it can be to figure out which is the best outcome to bet on.
However, if this is indeed a throw of a dice, in the long term, by betting on all outcomes with a better price than 6.00 (probability of 16.66%), you will be at a huge advantage and making a profit against the bookmaker.
This is because you are getting better odds than the real chance.
Let's go back to the coin toss example and put this in a table and explain how the bookmakers ensure that they make a profit in the long term by setting the odds.
| Outcome | True % | True Odds | Bookie Odds | Bookie % |
|---|---|---|---|---|
| Heads | 50% | 2.00 | 1.80 | 55.6% |
| Tails | 50% | 2.00 | 1.80 | 55.6% |
| Total | 100% | 111.2% |
So here we are again and the bookmaker is offering worse than even odds for either outcome.
It is possible for you to predict the coin toss correctly, and indeed win. In this instance, you would £8 profit for correctly predicting the right side with a £10 bet. You may even do that three or four times on the bounce. But the reason you are winning and in profit is pure luck, and nothing to do with making a value bet.
In the long run, you would not be able to maintain that luck and the numbers and bookie edge will take over to ensure that the bookie makes the profit and not you.
To prove this, I used an interactive coin toss, to test 1000 flips, 5 times to get individual outcomes and a 5000 coin toss total breakdown
| No Of Flips | Heads | H% | Tails | T% |
|---|---|---|---|---|
| 0-1000 | 516 | 51.6% | 484 | 48.4% |
| 1001-2000 | 472 | 47.2% | 528 | 52.8% |
| 2001-3000 | 489 | 48.9% | 511 | 51.1% |
| 3001-4000 | 502 | 50.2% | 498 | 49.8% |
| 4001-5000 | 510 | 51% | 490 | 49% |
| Total | 2489 | 49.8 | 2511 | 50.2% |
Understanding Odds
Odds are a reflection of the chance or probability of a certain outcome in an event.
In any event, every outcome has a chance or probability of taking place. Odds are an interpretation of probability. The bookmakers form odds or prices to reflect those chances.
Read our odds comaprison guide to find out which bookie you should use.
Not all bookmakers will provide the same odds. Some will be better than others, so it is worthwhile ensuring you are getting the best betting odds available from a specific bookmaker when actually making your bets.
Most online bookmakers give you the option of which type of odds you want to use.
- Decimal Odds
- Fractional Odds
- US Odds
You will want to use the odds you are most familiar with, but you have the option. Here is the difference
Decimal Odds Explained
Decimal odds became more popular with the advent of online bookmakers and are the most popular format for football betting.
Decimal odds are displayed in a number format with decimals. Self-explanatory, So:
3.00 may be the odds on offer - Place a £1 bet at 3.00 odds, would return £3.00 - Deduct the £1 stake from the return to understand the £2 profit on the bet.
| Decimal Odds | Stake | Win Return |
|---|---|---|
| 1.50 | £10 | £15 |
| 3.00 | £15 | £45 |
| 6.50 | £5 | £32.50 |
| 13.00 | £2 | £26 |
Fractional Odds Explained
Up until around 2002 fractional odds were the most popular and most frequently used odds seen on the boards in a bookmakers shop or at a racecourse or greyhound track.
Fractional odds example
Place a £1 bet on fractional odds of 2/1, and your return would be 2 x your stake [£2] + Stake return [£1] - total return £3
The example table below used exactly the same odds as the table above but in fractional terms this time.
| Fractional Odds | Stake | Win Return |
|---|---|---|
| 1/2 | £10 | £15 |
| 2/1 | £15 | £45 |
| 11/2 | £5 | £32.50 |
| 12/1 | £2 | £26 |
How to Convert Decimal Odds to Fractions, or Fractions to Decimal Odds
On occasion, you may want to convert the betting odds from decimal to fractional or vice versa for yourself.
It is not always the easiest to find, but there will be an option where you can change the default setting to display the odds format of your choice.
Table of fractional to decimal conversion, with probability
| Fraction | Decimal | US | Probability |
|---|---|---|---|
| 1/2 | 1.50 | -200 | 66.7% |
| 4/6 | 1.62 | -150 | 60% |
| Evens | 2.00 | +100 | 50% |
| 6/4 | 2.50 | +150 | 40% |
| 3/1 | 4.00 | +300 | 25% |
| 6/1 | 7.00 | +600 | 14.3% |
| 12/1 | 13.00 | +1200 | 7.7% |
| 25/1 | 26.00 | +2500 | 3.8% |
| 100/1 | 101.00 | +10000 | 1% |
The table above is a small example of decimal and fractional conversion with implied probability included
If you want to use decimal odds but are used to fractional you can easily convert them using a more in-depth odds conversion table or you could do it manually.
Manual Odds Conversion
To convert decimal odds to give you a probability percentage, you divide 1 by the decimal odds and multiple by 100, ie. Odds of 4/1, decimal of 5.00 would be 1 / 5.00 (*100) = 20%.
To convert the other way of probability percentage to decimal odds you would divide 1 by the (percentage / 100) and multiply by 100, ie. Odds of 4/1, probability of 20% would be 1 / (100 / 20) *100 = 5.00.
Converting fractions into implied probability
Every bookmaker price can be converted into a probability percentage figure.
For instance, 9/4 represents the probability of 30.769%.
How did I get that?
Add the 9+4 = 13 and then divide by the 4 this gives you 3.25. 100 (the %) divided by the 3.25 then gives you the 30.769.
A quicker way to get there is to memorize what the decimal version of the fraction is and use that.
One unit at 11/4 gives you a return of 3.75, 100 divided by 3.75 gives you 26.667 and that is the percentage 11/4 would represent.
Hopefully, you get the idea!
This is how bookmakers work to create their margin
Once you convert all odds to percentage probability, you can add them up, and they will amount to more than 100%.
Whatever the amount over 100% is called the bookmakers overround, or ‘edge’ - This is the bookmaker’s profit margin, we will look closer at this a little further down the page.
Understand How US Odds Work and When To Use Them
You will have noticed in the table above I have included the US Odds equivalents.
If you wish to bet on US Sports then you may also need to understand American odds.
Rarely used on UK betting sites, they can be chosen as a preferred option if you want. They can be fun when betting to stake or win £100 - I’ll explain why
US Odds are very different from either decimal or fractional odds and take some getting used to. You will notice the numbers will have a plus [+] or minus [-] sign in front.
This is important in understanding the favourite or underdog in an event.
Difference between plus [+] and minus [-] US Odds
- Positive odds show how much you would win if you stake 100 units.
- Negative US odds show how big a stake is needed to win 100 units.
Example
US Odds = ‘+400’
Betting £100 would win a profit of £400
If there is a - [minus] sign then they show how much you need to stake to win £100.
US Odds = ‘-175’
Betting £175 would win a profit of £100
MoneyLine Odds Comparison
Using the 2020 Superbowl in the NFL, A game which incidentally produced one of the smallest spreads in the history of the big game, let's take a look at how the US Odds compared to Fractional and Decimal.
This highlights how US Odds work better when betting on US Sports.
| Team | US Odds | Fractional | Decimal | % |
|---|---|---|---|---|
| Kansas | -117 | 6/7 | 1.85 | 54.1% |
| San Francisco | -103 | 32/33 | 1.97 | 50.7% |
Due to the closeness and competitiveness for the game, this example is very close to the coin toss example at the top of this section.
Note how much easier decimal odds are in this scenario against fractional.
The over-round on this book is just 4.8%. You can figure this out by adding the two probabilities of 54.1 and 50.7 together for a total of 104.80% Meaning a 4.8% profit for the book.
A History of How Bookmakers Odds Usage Has Changed Over Time
We have seen in more recent times how decimal odds have become more popular.
Fractions are rarely used online, and less so for football betting.
In horse racing, the older generations will still use fractions, although again online betting will see more decimal usage, while 'on-course' you may see both fractions and decimals used.
Less known these days is a process called 'Betting to Fractions'
Betting to Fractions
Things have changed over time in how bookmaker work with odds. One way for on-course bookmakers to offer extra value to punters was to offer the “fractions” when laying a bet.
What did “laying the fractions” actually mean?
If you were placing a bet at a price that didn’t divide equally into 100 then the bookmaker could give you slightly better odds to make the profit up to factors of 100. For example, if you wanted to back your selection at odds of 14/1, each £7 you placed would return you a profit of £98. In that instance, bookmakers would lay “100 to 7” increasing your return by £2 for every £7 staked.
Other examples of “fraction” betting include:
- 6/1 = £100 to £16 (instead of £96 to £16)
- 7/1 = £100 to £14 (instead of £98 to £14)
- 8/1 = £100 to £12 (instead of £96 to £12)
- 12/1 = £100 to £8 (instead of £96 to £8)
- 14/1 = £100 to £7 (instead of £98 to £7)
- 16/1 = £100 to £6 (instead of £96 to £6)
- 33/1 = £100 to £3 (instead of £99 to £3)
The above practice was in place at horse racing and greyhound tracks all over the country, but this bonus was at the discretion of the individual bookmaker.
The punter would not be given this bonus unless they specifically asked the bookmaker for the “fractions”.
The bonus would then be agreed or declined by the bookmaker depending on his or her view on giving this bonus generally or it could be declined if the bookmaker was already in a losing position on the selection concerned.
Use of the “fractions” was also convenient to the bookmaker as it made keeping a tally of their potential profit and loss far easier when the returns for each bet were in whole numbers such as £10, £50 or £100.
Since the introduction of computer technology into the profit and loss figures for on-course bookmakers, the laying of “fractions” has become far less commonplace as the “book” is automatically tallied rather than relying on the mathematic skills of the bookmaker’s clerk making the “fractions” offer less relevant to the bookmaker.
Gambling 'Odds Terms' Explained
You may come across some terms for betting odds used in this guide, or on bookmaker websites that you do not understand. Here I run through the most frequently used betting terms that will help you when understanding how bookmakers work with odds.
Fixed Odds Betting
When you place a fixed-odds bet, you are staking money against the bookmakers’odds to predict the outcome of the event.
What is fixed odds betting? - Fixed-odds betting is the most common way odds are offered by bookmakers. You know the odds at the time of placing the bet and therefore know what the return of your wager will be if you make a correct prediction.
Fixed odds are not:
- Starting Price (SP) Betting
- Pool Betting
- Spread Betting
Starting Price (SP) Betting
Betting to SP is exclusively limited to anywhere there is an on-course betting market. Most frequently associated with horse racing, greyhounds etc.
What is Betting to Starting Price?
- SP or starting price betting is an odds format based around on course bookmakers odds present at the sporting event.
- The SP is determined by a range of chosen bookmakers’ prices at the point the race begins and is fed to bookmaker shops and sites to settle bets once the result is known.
- You will get SP prices if you elect not to ‘take-a-price’ at the time your bet is placed.
Best Odds Guaranteed Betting
Best Odds Guaranteed ensures you get the best price between the one you take and the starting price (SP), whichever is the bigger, on horse racing and greyhound racing.
Not all bookmakers offer best odds guaranteed, but we have a comprehensive list of the best bog bookmakers.
Every BOG bookmaker rated
Pool [Tote] Betting
Another way of how bookmakers work is with pool betting.
What is betting on the Tote?
- Pool or Tote betting is like a lottery, where all the stakes are ‘pooled’ together.
- A cut is taken for administration (profit) and the remainder of the pool distributed as dividends to all winning bets.
Pool or tote betting is most often found at a racecourse where bets are taken directly into the pool. These days you can make tote bets online with your favourite bookmaker.
We have a complete guide to tote or pool betting where you can find more information on Jackpot, placepot, exacta bets and more.
Spread Betting
Spread betting is very different from traditional betting methods and is prevalent in financial markets but is becoming more popular in sports betting.
What is Spread Betting?
- Spread betting is buying and selling bets on an event where the profit or loss on any given bet is based on the accuracy of the prediction.
- The more accurate the prediction, the more you win, conversely the more you are wrong, the more you stand to lose.
Read our Sports Spread Betting Comparison Guide
Spread betting can be complicated for beginners and research and care are advised if starting to get involved.
For more information please refer to our detailed spread betting guide.
Stake
When placing a bet, your stake is the amount of money which you risk or gamble. If you win then your winnings are calculated according to the odds at which your bet was agreed.
If your prediction is not correct you lose your stake.
Laying Odds
This is another term for a bookmaker taking bets. By agreeing your bet, the bookmaker is laying that particular outcome of the event.
The bookmaker is risking their money to lay, or to promise to pay the winnings, should your bet be successful.
Odds Against
Odds against is the term used to describe a bet where you will receive a return of more than double your stake. The profit on the bet will be more than your stake.
Even Money
Also known as EVS, this is when the return will be double your stake. The profit on your bet will be the same as the amount you staked. Both you and the bookmaker are risking the same amount on the bet.
Odds On
Odds on is the term used to describe a bet where you will need to stake more than you will win, In fractional terms, this is anything with odds of less than EVS, so 1/2 is odds on. The word 'on' indicates that the odds are reversed. You may hear the expression 2/1 on referring to a selection with odds of 1/2.
Short Odds
This indicates that a selection has a good chance of winning. Short odds will be where you wouldn't receive a large return for your investment. For example, a horse at 6/4 would be considered short odds.
Long Odds
This indicates that a selection has a reduced chance of winning. If you bet at long odds you will receive a good return on your investment if you are correct. For example, a horse at 50/1 would be considered Long Odds.
For explanations of other terms see our Betting Terminology A-Z guide
How do Bookies Make Money
The use of the betting odds is a huge part of how bookmakers make money and sustain a business model.
Of course, there are other factors including free bet promotions, features and more, but these too, will all be based around the simple premise of selling undervalued odds to a customer, so a profit can be made.
How do they balance the books
Bookmakers balance the books by creating odds which are lower than the real or perceived probability of an event happening, so that if equal numbers of bets were taken across the entire range of offers for a single event, a profit would be made regardless of the result.
Betting exchanges comapred
How do bookmakers work to make money?
- It is a simple process of controlling how much is stood to be won or lost by taking bets on an event or range of events.
- The outcome of the event can not be 100% guaranteed, but by using odds and the built-in 'overround' within the prices, the bookmaker can control how much money, [roughly] they will make in the long term by consistently offering odds that are slightly lower than the perceived implied probability.

You can get a feel for how this is done by using a website like the Matchbook Exchange. here you have the opportunity to act as the bookie, and offer and 'lay' bets as a bookmaker yourself.
You will understand by experimenting this way just how tricky it can be to ensure a profit, by laying bets to other punters at different stakes and odds, especially when you are competing with many other people doing exactly the same.
It can be fun playing the bookmaker on exchanges and many people do indeed make a living from doing so, but it remains fraught with danger but for the very skilled, it is however a quick route to understanding how bookmakers work.
How do Bookmakers Calculate Odds
Bookmakers don't have it that easy. They don't just set the prices on the toss of a coin!
Because they take bets on sporting fixtures for which the outcomes are difficult to predict, they need to work hard at getting those odds correct.
The major bookmakers employ a team of odds compilers to set their prices.

A horse racing odds compiler may have a number of contacts or helpers ranging from private handicappers and form experts to gallop watchers at various stables.
Once they have analysed all the information available, they will set about converting this into the percentage chances of each runner winning the race and create tissue prices.
What is a betting tissue?
A betting tissue is the first draft of odds calculated for an event. This range of odds do not last long once the money starts to enter the market and odds adjusted accordingly.
The Tissue is the probability of the outcome converted to odds prior to the bookmaker's margin being added in.
Do not confuse a 'betting forecast', like you will on a race card in the Racing Post as the Tissue. It is not!
This OLBG Blogger gives a full explanation
As explained, the 'tissue' is not the betting forecast and will very rarely match the final odds on an event prior to the event starting.
For a start, the tissue needs to have the 'bookmakers edge' applied to ensure a profit on the book based on the bets taken at the odds on offer.
So let's take a look at the Bookmakers:
- Edge
- Margin
- Over-round
All terms meaning the same thing.
Bookmakers Edge and How They Use it to Make Money
Bookmakers need to include an edge for themselves. This is effectively the business profit and all businesses need to work to a profit.
So tissue pricing, otherwise known as the odds available to bet on, will include a margin to help the bookmakers make a profit at the end of the event, regardless of the result.
What is the bookie’s margin?
The bookmakers’ margin is the amount of profit they can, or will make on a single betting market on a given event. The bookmakers’ margin is also known as the ‘Overround’ or in America as ‘Vigorish’, commonly shortened to ‘Vig’
What is ‘Overround’?
When the bookies set the prices they work in the 'overround'. For example, Man United can win, lose or draw a game but the odds for those three outcomes will imply more than a 100% chance of that happening.
Example of a 10% Overround
- Man United to win 6/4 [2.50]
- Man United to lose 6/4 [2.50]
- Man United to draw 7/3 [3.33]
The probabilities of these outcomes, according to the bookie, are 40%, 40% and 30%. = 110% - The overround, in this case, is 10%.
Let's put that into a table so that the excess percentage is more visible
| Fraction | Decimal | % | |
|---|---|---|---|
| Man Utd Win | 6/4 | 2.50 | 40% |
| Draw | 7/3 | 3.33 | 30% |
| Man Utd Lose | 6/4 | 2.50 | 40% |
| Total Percentage | 110% | ||
| Over-Round | 10% |
Example of a 20% Overround
- Man United to win 4/6 [1.66]
- Man United to lose 2/1 [3.00]
- Man United to draw 11/4 [3.75]
The probabilities of these outcomes, according to the bookie, are 60%, 33.33% and 26.66%. = 119.99% - The overround, in this case, is 20%.[ish]
How to work out the overround/edge
The bookies may decide that they want to make £10 for every £100 they take and set their over-round on that market at 110% as per the first example above.
To build this into the odds they take their calculation of each selection chances and shorten some or all of their odds. Bookmakers are often criticised by punters for making the over-round too high.
The Grand National is a classic case in point, where every year the bookmakers are criticised for making the book too far in their favour - a 163% book in the 2019 renewal for instance.
Bookmakers Margin By Sport - Which Sport do Bookmakers Have the Lowest Margin on?
I've taken a bit of time to analyse a huge number of markets to discover the average over rounds per market, and then break that down by the average margin per outcome.
For instance, in a Tennis match, the over-round is the lowest of the sports I looked at 3.5%, with only two possible outcomes in the market, this equated to 1.75% margin for each.
What was really interesting is that in football, whilst the overround on the event was similar at 3.5% for the FA Cup Final and 3.6% for Premier League Matches, which 3 possible outcomes of Home, Draw & Away, the individual outcome margin dropped to a very small 1.16-1.20%
Note how the more marginal the sports, such as darts and snooker, see a larger bookies margin.
Sports Margins by Outcome
Premier League Football @ 1.16%
Tennis Match @ 1.75%
NBA Basketball @ 2.08%
NFL Football @ 2.4%
Darts @ 2.6%
Snooker @ 2.82%
Greyhound Racing @ 4.3%
So if you were looking to bet on the best sport for the smallest bookmaker margin, Premier League Football would be your best choice.
The reason there are larger margins on the smaller sports is a reflection of the expectation of the weight of bets and total stakes expected.
The more money placed into a market, the easier it is to balance and the smaller the risk, therefore the smaller the margin can be easier to guarantee a profit.
The larger margin on Snooker and Darts is reflective that overall, less money is likely to be bet and therefore, a bigger margin helps balance the books with a lower overall turnover on the event.
| Sport | Over-Round | No of Outcomes | % per Outcome |
|---|---|---|---|
| Tennis Match | 3.5% | 2 | 1.75% |
| FA Cup Final 2019 | 3.5% | 3 | 1.16% |
| Premier League Games | 3.6% | 3 | 1.20% |
| NBA Matches | 4.16% | 2 | 2.08% |
| NFL Matches | 4.8% | 2 | 2.4% |
| Darts | 5.2% | 2 | 2.6% |
| Snooker | 5.64% | 2 | 2.82% |
| Horse Racing | 15.4 | Various | n/a |
| Cheltenham Gold Cup | 23.2% | Various | n/a |
| Greyhound Racing | 25.8% | 6 | 4.3% |
| Grand National 2019 | 63% | Various | n/a |
Sources: Australian open tennis matches, Premier League 7/3/20, NBA 11/3/2020, NFL, playoffs and final 2020, Darts PDC World Championship 2019, Snooker, English Open 2020, Horse racing Hereford 3/1/20, Greyhounds, Hove 23/1/20
Premier League Over-rounds and Averages for 7th March 2020
| Match | H | D | A | Margin |
|---|---|---|---|---|
| Burnley v Tottenham | 2.72 | 3.35 | 2.70 | 3.7% |
| Arsenal v West Ham | 1.64 | 4.30 | 5.21 | 2.4% |
| Crystal Palace v Watford | 2.73 | 3.10 | 2.89 | 3.5% |
| Sheff Utd v Norwich | 1.68 | 3.91 | 5.41 | 3.6% |
| Southampton v Newcastle | 1.74 | 3.86 | 4.93 | 3.7% |
| Wolves v Brighton | 1.73 | 3.75 | 5.25 | 3.5% |
| Liverpool v Bournemouth | 1.22 | 7.19 | 12.59 | 3.8% |
Different Bookmaker Overrounds by Football Leagues in the UK
As we saw for the different sports, with lower margins for the more popular sports to the more minor events, I thought I would take a look at the over rounds for various Football Leagues to see if popularity was also reflected in the margins applied to the WDW betting odds.
This was certainly the case with Premier League leading the way on low margins, and those margins getting bigger the lesser the league status, right down to non-league Isthmian Premier League just under 10%
| League | Average Overround |
|---|---|
| Premier League | 3.6% |
| Championship | 4.86% |
| League 1 | 5.31% |
| League 2 | 5.38% |
| National League | 6.71% |
| Isthmian Premier League | 9.64% |
Different Bookmaker Margins by Major Football Leagues
The case of the English Leagues differing as we went down the scale got me thinking about the Major European and international leagues too, so I spent some looking at them too.
Again, in terms of global betting popularity, the margins really did mirror the weight of interest.
| League | Average Overround |
|---|---|
| Premier League | 3.6% |
| La Liga (Spain) | 3.96% |
| Bundesliga (Germany) | 4.14% |
| Serie A (Italy) | 4.26% |
| Ligue 1 (France) | 4.48% |
| MLS (USA) | 5.4% |
| A-League (Australia) | 5.5% |
Read how EW margins are worked out
Do Bookmakers Ever Lose?
On occasion, bookmakers will lose, but they don’t make a habit of it. A string of favourites winning at a horse racing meeting can put a dent in the bookies’ satchels.
Take the Frankie Dettori Magnificent 7, at Royal Ascot in 1996 as an example. He rode winner after winner and punters just followed Frankie all day clearing the bookies out for some amazing sums.
Frankie Dettori's Magnificent 7 Winners
- Wall Street @ 2/1
- Diffident @ 12/1
- Mark of Esteem @ 100/30
- Decorated Hero @ 7/1
- Fatefully @ 7/4
- Lochangel @ 5/4
- Fujiyama Crest @ 2/1
When do bookmakers limit accounts?
There are a range of reasons why a bookmaker will limit accounts or make restrictions on betting stakes.
- Bad Each Way Races
- Early Prices
- Evidence of Arbing
- Only Betting at Best Odds
- Abusing/Only Betting on Promotions
What is a Bad Each Way Race?
A bad each way race refers to betting each way on horse races that, thanks to the way place betting odds are figured out, work in the favour of the punter and not the bookmaker.
What is a Bad Each Way Race?
What is Arbing?
Arbing, otherwise known as arbitrage betting, is using more than one bookmaker to take odds on an event whereby regardless of the result a profit can be made.
Usually, this will involve using one bookmaker that is guaranteeing best odds - Another example in the bullet list above
What is Arbing?
The activity is fraught with danger and not encouraged as only small profits can be gained and high stakes are needed making it a high-risk strategy, which will eventually lead to account restrictions and limits.
NOTE: Whilst your account may suffer stake limitations and restrictions for using the above tactics, continued use could see your account closed entirely
You May Not Just be Restricted
Best bookies to avoid restrictions
When Do Bookmakers Close Accounts?
- Bonus Abuse
- Winning Too Much
- Suspicious Activity
- Raising Stakes in an Unusual Manner
- Multiple Accounts
What is Bonus Abuse?
Bonus abuse is when a player takes advantage only of opening offers and promotions, which is often the activity of matched betting strategies.
What is Suspicious Betting Activity?
Suspicious activity could encompass a sudden change from your normal betting pattern, with larger stakes on successful bets. You may even get caught up making an honest bet within a market where other suspicious activity such as match-fixing potential is identified.
Why do Betting Odds Change?
This article has made mention of fixed-odds betting and of course, fixed-odds does not mean that the odds will not change, so
The movement off odds is a fundamental aspect of making a betting book on any event, it also produces some scenarios and terms such as 'steamers' and 'drifters'.
What are steamers and drifters
Let's look more in depth on the subject to understand how it works with some real-life examples too.
What Makes Betting Odds Change?
There are two main reasons why prices change in betting markets. One is knowledge, the other is money. Both make the world go round, don't you know.
Why Knowledge and News Affects Market Prices
Imagine a scenario where one football team relies heavily on one strike to score the vast majority of its goals.
Let's take Manchester United and Zlatan Ibrahimović at a time.
The odds for the next weekend's games are published in advance, sometimes even longer than a week in advance, but in training on a Wednesday before the game, Ibrahimović is seen limping off, and reports coming through that he won't be able to play at the weekend.
This is important information, and given the side rely heavily on the striker to score the goals, will be missing a key player.
The perceived probability of a Manchester United win as assessed prior to this news would have contributed to the forming of the first published prices.
With Manchester United's diminished chances based on the injury, the market would also try to be adjusted before the news is widespread and the shrewd punters take advantage of opposing the price by betting on the draw or a United defeat.
How Money Changes Betting Prices
Using the same scenario, if the bookmakers did not have knowledge of the injury, but a good number of big staking punters did and they started betting heavily against Manchester United at odds that were now bigger than they should be, the bookmakers would have to react quickly to the liabilities growing on the bets being made.
They do this by adjusting the odds on the outcome being bet on, (potentially removing the value for the punter), and lengthening the opposing outcomes, to attract more money to the market to balance the book and ensure a profit whatever the end result.
This weight of money, in this case, is the cause of the price movement. the contraction of the price on the outcome being bet on, and the lengthening of the outcomes not being bet on.
If we applied this same betting scenario to horse racing price movements, and in particular significant shortening or lengthening of the odds on a single runner, they may be referred to as 'Steamers' and 'Drifters'
Example of the Effect of Weight of Money on a Betting Market
Let's go back to the gold old coin toss as an easy example of how money can move a market and why odds change as money is bet.
Using the odds, I used earlier as 1.80 for both possible outcomes.
This includes the bookmaker's margin, let's see why the odds would change as bets are made in a step by step process
- Opening Market Heads 1.80 (55.6%) - Tails 1.80 (55.6%) 111.2% Book
- Someone bets £100 on Heads at 1.80 standing to win £80
- The bookmaker now stands to lose £80 if heads is the result, but win £100 if tails comes up
- To Balance the book and ensure a profit, the bookmaker needs to change the prices
- Market reset to Heads 1.67 (59.9%) - Tails 2.05 (48.8%) 107.6% book
Without doubt, the next bet that would be placed would be on tails given that odds of 2.10 are better than the real probability, 47.6% against real 50%. - Let's for the sale of the example say £100 is bet at 2.05
The book now looks like this
- Bookmaker has taken £200 in bets
- If Heads is the result he pays £180 and has £20 profit
- If Tails is the result, he pays £205 and loses £5
Now what the bookmaker will do is adjust the odds of each outcome again to encourage more bets on either outcome so that the book can be balanced and a small profit made regardless of the outcome.
How to take Advantage of Betting Odds Movement
The best way to take advantage and profit from betting odds movement is to 'bet against' the crowd. But you have to identify the opportunity being real and be brave in the same moment.
In the example above the odds for tails drifted out because of the weight of money on heads which became the favourite. This has resulted in the opportunity of betting at better than real probability and would be an example of betting against the crowd to get value.
Another way to take advantage of significant market moves is to be in 'early; at the start of the movement, and not one of the crowd following the move and entering at a point whereby the true value of the bet has actually been taken up.
We do see this in action in the free OLBG Tips Competition, where those on the ball take advantage of early gambles...... before the odds have shrunk.
Find a Value Bet
For more information on betting against the market to find the value bet, take a look at our lesson on value betting where we go in-depth on finding good bets in moving markets.
Changing Odds Betting Systems
Many a betting system has been built with a view to taking advantage of betting odds markets movements. In the vast majority of cases, in fact, I will attest to trying dozens of these systems, and of all I tried, none have worked over the test of time..

The problem being, the value in the wager has gone before you have a chance to grab a price that provides an opportunity for long term profit.
A short term win may be achieved, but tested over a period of time, this will demonstrate,at best, slow loss and erosion of well-managed profits.
How to Be A Bookmaker
'You never see a poor bookie' or so the saying goes!
What about becoming the bookmaker yourself? Surely that is the way forward to make money from gambling rather than taking on the established bookies and betting against the overground rather than with it?
To begin a fully licensed, legal gambling company is not just a matter of a few steps, and your ready to go with a £500 loan.
As you can imagine there is far more to it than that, and certainly, a HUGE amount of money required. You could, however, get started on a smaller scale with zero overheads on a betting exchange.
The Easy Way on Exchanges
The easiest way to become a bookmaker is to lay your own bets to punters looking to make a bet on one of the betting exchanges.
UK Betting Exchanges
- Matchbook
- Smarkets
- betDaq
If you want to know which is the best betting exchange for you to become your own bookmaker, it would be very worthwhile comparing betting exchanges.
Become a Real Bookmaker
What do you need to become a real, bonafide bookmaker, either on course at a race track, with a betting shop on the high street, or an online gambling website?
Which Type of Betting Business do you want to be in?
- On-Course Bookmaker
- Betting Shop on the High Street
- Online Betting Site
- Online Casino
The very first thing you would need to do if you had any hopes of taking your professional gambling business forward would be to get into contact with the Gambling Commission. They can advise you on everything you need to do from a legal and licensing standpoint, depending on what type of business you are looking to undertake.
How much does bookmaker pitch cost at a racecourse?
The first thing to consider is that an on-course bookmaker is not going to make the type of money Denise Coates of bet365 will. In fact, some on-course bookmakers make quite a modest living, and others have, in recent years, given up pitches and businesses off the back of ever-decreasing on course betting activity.
There do remain some prime on course pitches though. And they are so sought after, that crazy sums of money can change hands for the right to pitch up at them at the biggest horse racing meetings.
Whilst many pitches will now be totally unoccupied during the course of a season due to their low worth, others are still changing hands for 6 figure sums in the right places.
If you know some horse racing bookies, or particularly one of the more popular independent pitches at the Cheltenham Festival then you will be familiar with the name Freddie Williams. The late bookie's pitch has been looked after by his daughter at Cheltenham since his passing but was recently put up for auction with again a 6-figure reserve.
If you are just starting out, then you will be looking for a far more modest pitch purchase, and they are available, sometimes at very low prices, but do not expect to be bowled over by business on a cold Thursday afternoon in February at a provincial track and minor meeting.
What About a Shop, Website or Casino Site?
No matter what side of the gambling business you want to operate in as the bookmaker, if that concerns a website or a high street shop, you are going to need backing. And a lot of financial investment.
In which case you need a solid business plan and model, a point of difference to excite any potential investors and some balls!
In recent years and with the development of online betting, there have been scores and scores of new online betting sites appearing, trading for a little while and then disappearing just as quickly and without a trace.
To even become noticed in a crowded and competitive online space, a HUGE marketing budget is going to be needed, and then something to break customers loyalty to come and bet with you instead of someone else.

How to get a licence
Whatever way you decide about becoming a bookie, you will be governed by law to hold a licence for your trading activity.
There is a range of different types of licence you may need to become a ‘real’ bookmaker or run a gambling based business.
- an operating licence
- a personal management licence
- a personal functional licence
- a premises licence if you provide facilities for remote gambling
The best to find out all of these details would be from the UK Gambling Commission who will be able to advise on what you need and provide a lot more detailed information and advice about running a gambling business of any kind.
KEY TAKEAWAYS
Related Content to Bookmakers and Betting Odds
Whilst this is a huge and in-depth subject, there is yet more to be learned from how bookmakers operate, including how we as punters can take advantage of when they make mistakes in setting odds.
We have prepared a short list of betting articles related to this subject
If you take your betting seriously please take in all the information via these links. .
RELATED ARTICLES
BETTING SYSTEMS - Systems that work and ones to avoid

Betting Systems Unleashed – Your Comprehensive Guide
SENSIBLE GAMBLING - How to avoid the pitfalls of sports betting

How to be Sensible and Gamble Responsibly (Examples)
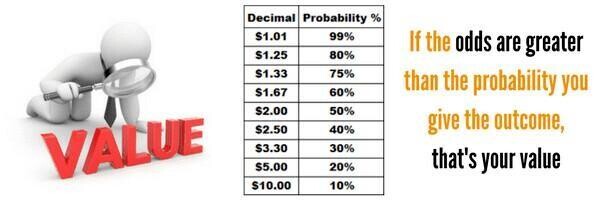
VALUE BETTING - How to get the odds in your favour when betting on sport

Master the Art of Value Betting and Maximize Your Winnings
OLBG MEMBER BLOGS
The odds convertor article is invaluable, it will help you price up races or matches in terms of percentage probability.
Odds Converter | Fractional to Decimal Odds & Probability
Understanding Bookmakers Frequently Asked Questions
FAQ
Understanding Bookmakers FAQ's
Can you lose money on a winning bet?
A winning bet by default is a profitable bet, so the answer is no. But it is possible to have winning predictions, but receive less back than the initial outlay. This would most commonly happen with each way betting or full cover bets.
How do I start my own bookie?
The best to start your own bookie business would be to cut out the huge liabilities of setting up a business and start out small using a betting exchange. Here you can practice your skills in using the exchange book to lay bets to find out if you would like to take the venture further.
Do bookies want favourites to win?
When favourites win bookies will claim it to be bad for business. That's not always the case and on occasions, bookmaker may feel a favourite for a horse race should not be, in which case he may offer bigger odds than rival bookmakers to get more bets placed. The horse in question may still be the favourite for the race, but this particular bookmaker stands to win more if it the favourite for the race prevails.
Is it possible to beat the bookies?
It is possible to beat the bookies, of course. However, you do need to understand odds, be able to predict events well and be able to spot a good value bet, or odds that are bigger than they should be to be able to take advantage. And when you do, you might have to find ways of keeping your account open or not restricted to take full advantage - Good Luck!
Where do bookies get their information?
Bookmakers have an endless supply of information at their fingertips in order to provide the most accurate prices they can. From huge data sets, and teams of people looking at stats as well as contacts with some of the best professional punters, they are well placed not to make mistakes and allow you to win. However, there is still human input into running a bookmaking business and some small errors in pricing can often be found.
What is a Turf Accountant?
A Turf Accountant is old-fashioned, and if one wants to be pedantic, the correct term for what you might better know as a bookmaker. Primarily offering gambling service for horse racing at the time the term was popular, it is an accurate description, as opposed to the less formal bookmakers, or ‘those making a gambling book for betting purposes’