With 30+ years in racing and betting, Darren helps punters develop their skills. As OLBG’s Tipster boss and expert guide, he turns insight into winning strategy.
How much more likely is your selection to fall or unseat depending on the track they are running at?
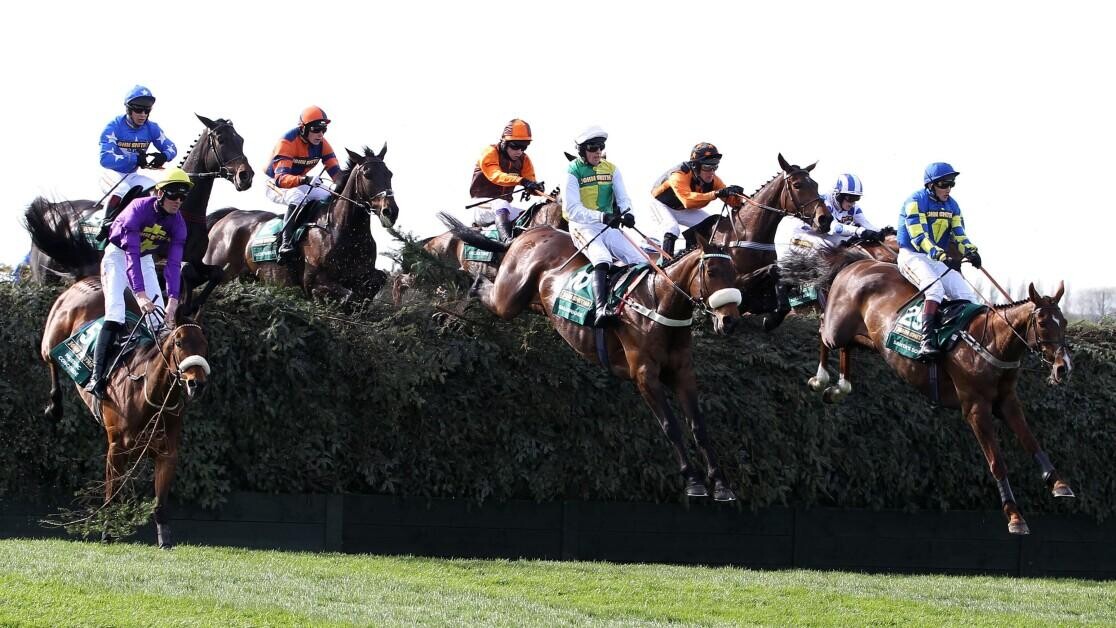
I imagine if you ask any National Hunt fan, they will know that the Aintree Grand National fences are the hardest jumping test in the UK, but which other tracks offer a stern test of jumping? Are there some tracks where jumping prowess is not tested as much?
If someone had asked me which tracks (Aintree aside) had the hardest fences to jump round I probably would have said Cheltenham, Sandown and Ascot. As I didn't have any actual figures to base that on, I thought I'd have a quick look and see how each of the UK tracks compared to each other for falls and unseats. I looked at five complete years from 2013 to 2017 inclusive and some of the figures certainly surprised me. Obviously, the statistics need to be taken at face value and no factoring has been made for the quality of horse running at the track, the going or if there have been any changes in the fence build or situation at the tracks concerned. The tracks have been listed in the percentage of falls and unseats over fences combined:
| Number of falls and unseats over fences at each UK track 1/1/13-31/12/17 | |||||||
| Track | Chase runners | Falls | Fall % | UR | UR % | Fall + UR | F+UR% |
| Aintree NATIONAL | 519 | 72 | 13.87% | 58 | 11.18% | 130 | 25.05% |
| Fakenham | 826 | 79 | 9.56% | 58 | 7.02% | 137 | 16.59% |
| Wincanton | 1384 | 99 | 7.15% | 51 | 3.68% | 150 | 10.84% |
| Catterick | 798 | 54 | 6.77% | 31 | 3.88% | 85 | 10.65% |
| Kempton | 1266 | 77 | 6.08% | 56 | 4.42% | 133 | 10.50% |
| Fontwell | 1970 | 60 | 4.69% | 72 | 5.63% | 132 | 10.33% |
| Musselburgh | 822 | 53 | 6.45% | 31 | 3.77% | 84 | 10.22% |
| Newcastle | 925 | 59 | 6.38% | 33 | 3.57% | 92 | 9.95% |
| Ayr | 1120 | 72 | 6.43% | 39 | 3.48% | 111 | 9.91% |
| Hereford | 226 | 13 | 5.75% | 9 | 3.98% | 22 | 9.73% |
| Newbury | 1287 | 67 | 5.21% | 49 | 3.81% | 116 | 9.01% |
| Cheltenham | 3201 | 182 | 5.69% | 105 | 3.28% | 287 | 8.97% |
| Taunton | 977 | 53 | 5.42% | 34 | 3.48% | 87 | 8.90% |
| Aintree MILDMAY | 914 | 44 | 4.81% | 37 | 4.05% | 81 | 8.86% |
| Ludlow | 1591 | 76 | 4.78% | 65 | 4.09% | 141 | 8.86% |
| Plumpton | 1160 | 54 | 4.66% | 46 | 3.97% | 100 | 8.62% |
| Towcester | 1197 | 53 | 4.43% | 49 | 4.09% | 102 | 8.52% |
| Doncaster | 1025 | 51 | 4.98% | 29 | 2.83% | 80 | 7.80% |
| Perth | 1339 | 52 | 3.88% | 48 | 3.58% | 100 | 7.47% |
| Wetherby | 1518 | 62 | 4.08% | 51 | 3.36% | 113 | 7.44% |
| Southwell | 1544 | 76 | 4.92% | 35 | 2.26% | 111 | 7.19% |
| Haydock | 951 | 36 | 3.79% | 31 | 3.26% | 67 | 7.05% |
| Chepstow | 1649 | 56 | 3.96% | 56 | 3.96% | 112 | 6.79% |
| Sedgefield | 1544 | 57 | 3.69% | 46 | 2.98% | 103 | 6.67% |
| Hexham | 1640 | 53 | 3.23% | 54 | 3.29% | 107 | 6.52% |
| Kelso | 1492 | 34 | 2.28% | 62 | 4.15% | 96 | 6.43% |
| Leicester | 1169 | 36 | 3.08% | 39 | 3.34% | 75 | 6.42% |
| Worcester | 2075 | 85 | 4.10% | 41 | 1.98% | 126 | 6.07% |
| Ffos Las | 1278 | 46 | 3.60% | 31 | 2.43% | 77 | 6.03% |
| Stratford | 1836 | 56 | 3.05% | 49 | 2.67% | 105 | 5.72% |
| Ascot | 885 | 32 | 3.62% | 17 | 1.92% | 49 | 5.54% |
| Exeter | 1459 | 44 | 3.02% | 32 | 2.19% | 76 | 5.21% |
| Huntingdon | 1253 | 34 | 2.71% | 31 | 2.47% | 65 | 5.19% |
| Bangor | 1178 | 35 | 2.97% | 25 | 2.12% | 60 | 5.09% |
| Lingfield | 597 | 14 | 2.35% | 16 | 2.68% | 30 | 5.03% |
| Market Rasen | 1766 | 50 | 2.83% | 38 | 2.15% | 88 | 4.98% |
| Cartmel | 944 | 24 | 2.54% | 21 | 2.22% | 45 | 4.77% |
| Sandown | 1065 | 25 | 2.35% | 25 | 2.35% | 50 | 4.69% |
| Warwick | 1317 | 29 | 2.20% | 31 | 2.35% | 60 | 4.56% |
| Newton Abbot | 1567 | 34 | 2.17% | 35 | 2.23% | 69 | 4.40% |
| Uttoxeter | 2131 | 57 | 2.67% | 35 | 1.64% | 92 | 4.32% |
| Carlisle | 1264 | 32 | 2.53% | 18 | 1.42% | 50 | 3.96% |
Is Fakenham really the second hardest track to jump fences at in the UK?
Fakenham? Really? I was pretty amazed when the Norfolk track came out as the second hardest track to jump round over fences as it has never been a course that has stood out to me as a stern jumping test.
I was also shocked to see Cheltenham in twelfth place and Sandown and Warwick both in the bottom five. I had both down as courses that take a good bit of jumping. Perhaps those courses tend to attract higher quality fields and that may, in some way, explain why less than five percent of runners have fallen at those courses compared to a whopping sixteen percent plus at Fakenham. I would have thought the famous railway fences at Sandown would catch-out a lot of runners but perhaps the close proximity of those fences does more to take a horse out of its rhythm rather than bring about mistakes that mean a fall?
I was also quite surprised at the high ranking of Fontwell. Obviously, this is a quirky course with its figure of eight set-up, but I don't think I would have expected a figure of over ten percent of falls and unseats.
Carlisle lived up to its reputation as the place to send raw novices with a return of under four percent of fallers and unseats and appears to be the UK course where you are most likely to get round.
Further research
With 2019 now upon us there will now be a full year of statistics (2018) that we can compare the above five-year figures to and I hope to be able to add that comparison in the next few days.
I have checked the figures as much as I can but if you feel the figures are incorrect please do let me know.
It would be great to hear what other people think about the above figures and if it might make you think twice when taking a short price in a novice chase at Fakenham!


