With hundreds of different betting sites, finding the best can be confusing. I'll guide you through and find the most suitable bookie for you.
Superbowl Sunday
When it comes to sporting events and the glitz and glamour that comes with it, it is fair to say that nobody does it better than the NFL and with their showpiece annual event being not far from returning to the limelight, it is time to shine a light on the prestigious Superbowl and get your sports betting apps primed for action.
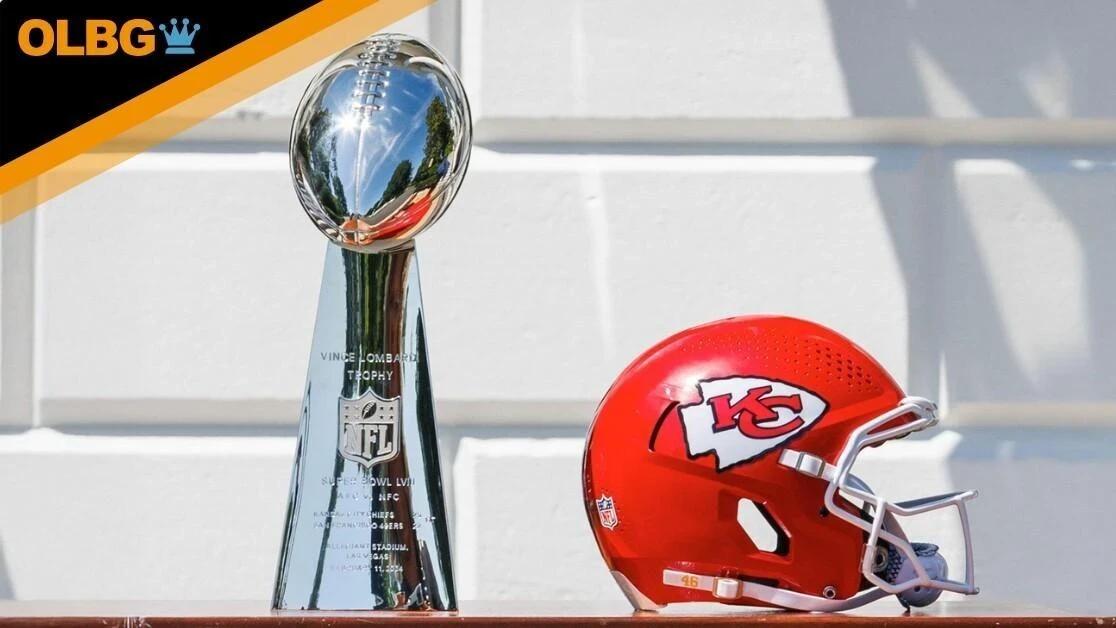
A game that brings the end to each NFL season and, in doing so, awards the Vince Lombardi Trophy to the team that comes out on top; with the eyes of not only a sporting nation but also the world, it is considered one of the richest prizes that any outfit can win and a massive hit with spread betting fans.
Starting back in 1967, an event with rather humble beginnings has grown into nothing less than a juggernaut, and it is not only the performance of football players that comes under focus, but also the musical acts that serve as the famous and sometimes infamous half-time show.
The event has also become one of the biggest betting sites events worldwide, with over $23.1B wagered on last years Super Bowl, more than any other!
Who’s who of American Football legends have played and most importantly won this game and with it being such a fixture in not just the sporting calendar but the United States’ calendar as a whole it is no surprise that this is the hottest ticket and biggest betting event in town.

The Top NFL Betting Sites 2026

Super Bowl LX Betting Guide
Super Bowl Betting Odds
Here are the current betting odds for the Superbowl offered by various bookmakers. Feel free to visit our top NFL tipsters for their NFL betting tips and see who they think will win across various markets
The Big Ticket

A ticket that has been snapped up by a total of 4,384,546 fans between 1967 and 2024, and with this fixture constantly generating big attendance from those who have travelled across the country or even across the world, OLBG have decided to crunch the numbers to reveal the top ten most attended Super Bowls of all time.
| Game | Date/Season | Winning team | Score | Losing team | Venue | Attendance |
|---|---|---|---|---|---|---|
| XIV | January 20, 1980 (1979) | Pittsburgh Steelers | 31–19 | Los Angeles Rams | Rose Bowl | 103,985 |
| XVII | January 30, 1983 (1982) | Washington Redskins | 27–17 | Miami Dolphins | Rose Bowl | 103,667 |
| XI | January 9, 1977 (1976) | Oakland Raiders | 32–14 | Minnesota Vikings | Rose Bowl | 103,438 |
| XLV | February 6, 2011 (2010) | Green Bay Packers | 31–25 | Pittsburgh Steelers | Cowboys Stadium | 103,219 |
| XXI | January 25, 1987 (1986) | New York Giants | 39–20 | Denver Broncos | Rose Bowl | 101,063 |
| XXVII | January 31, 1993 (1992) | Dallas Cowboys | 52–17 | Buffalo Bills | Rose Bowl | 98,374 |
| VII | January 14, 1973 (1972) | Miami Dolphins | 14–7 | Washington Redskins | Los Angeles Memorial Coliseum | 90,182 |
| XIX | January 20, 1985 (1984) | San Francisco 49ers | 38–16 | Miami Dolphins | Stanford Stadium | 84,059 |
| XLVIII | February 2, 2014 (2013) | Seattle Seahawks | 43–8 | Denver Broncos | MetLife Stadium | 82,529 |
| XVI | January 24, 1982 (1981) | San Francisco 49ers | 26–21 | Cincinnati Bengals | Pontiac Silverdome | 81,270 |
| VI | January 16, 1972 (1971) | Dallas Cowboys | 24–3 | Miami Dolphins | Tulane Stadium | 81,023 |
| IX | January 12, 1975 (1974) | Pittsburgh Steelers | 16–6 | Minnesota Vikings | Tulane Stadium | 80,997 |
| IV | January 11, 1970 (1969 AFL/1969 NFL) | Kansas City Chiefs | 23–7 | Minnesota Vikings | Tulane Stadium | 80,562 |
| X | January 18, 1976 (1975) | Pittsburgh Steelers | 21–17 | Dallas Cowboys | Miami Orange Bowl | 80,187 |
| XIII | January 21, 1979 (1978) | Pittsburgh Steelers | 35–31 | Dallas Cowboys | Miami Orange Bowl | 79,484 |
| V | January 17, 1971 (1970) | Baltimore Colts | 16–13 | Dallas Cowboys | Miami Orange Bowl | 79,204 |
| XXXIX | February 6, 2005 (2004) | New England Patriots | 24–21 | Philadelphia Eagles | Alltel Stadium | 78,125 |
| XII | January 15, 1978 (1977) | Dallas Cowboys | 27–10 | Denver Broncos | Louisiana Superdome | 76,400 |
| XXX | January 28, 1996 (1995) | Dallas Cowboys | 27–17 | Pittsburgh Steelers | Sun Devil Stadium | 76,347 |
| XV | January 25, 1981 (1980) | Oakland Raiders | 27–10 | Philadelphia Eagles | Louisiana Superdome | 76,135 |
| II | January 14, 1968 (1967 AFL/1967 NFL) | Green Bay Packers | 33–14 | Oakland Raiders | Miami Orange Bowl | 75,546 |
| III | January 12, 1969 (1968 AFL/1968 NFL) | New York Jets | 16–7 | Baltimore Colts | Miami Orange Bowl | 75,389 |
| XXIII | January 22, 1989 (1988) | San Francisco 49ers | 20–16 | Cincinnati Bengals | Joe Robbie Stadium | 75,129 |
| XXXIII | January 31, 1999 (1998) | Denver Broncos | 34–19 | Atlanta Falcons | Pro Player Stadium | 74,803 |
| XLI | February 4, 2007 (2006) | Indianapolis Colts | 29–17 | Chicago Bears | Dolphin Stadium | 74,512 |
| XXIX | January 29, 1995 (1994) | San Francisco 49ers | 49–26 | San Diego Chargers | Joe Robbie Stadium | 74,107 |
| XLIV | February 7, 2010 (2009) | New Orleans Saints | 31–17 | Indianapolis Colts | Sun Life Stadium | 74,059 |
| XX | January 26, 1986 (1985) | Chicago Bears | 46–10 | New England Patriots | Louisiana Superdome | 73,818 |
| XXV | January 27, 1991 (1990) | New York Giants | 20–19 | Buffalo Bills | Tampa Stadium | 73,813 |
| XXII | January 31, 1988 (1987) | Washington Redskins | 42–10 | Denver Broncos | San Diego–Jack Murphy Stadium | 73,302 |
| XXXVI | February 3, 2002 (2001) | New England Patriots | 20–17 | St. Louis Rams | Louisiana Superdome | 72,922 |
| XVIII | January 22, 1984 (1983) | Los Angeles Raiders | 38–9 | Washington Redskins | Tampa Stadium | 72,920 |
| XXIV | January 28, 1990 (1989) | San Francisco 49ers | 55–10 | Denver Broncos | Louisiana Superdome | 72,919 |
| XXVIII | January 30, 1994 (1993) | Dallas Cowboys | 30–13 | Buffalo Bills | Georgia Dome | 72,817 |
| XXXIV | January 30, 2000 (1999) | St. Louis Rams | 23–16 | Tennessee Titans | Georgia Dome | 72,625 |
| XXXI | January 26, 1997 (1996) | Green Bay Packers | 35–21 | New England Patriots | Louisiana Superdome | 72,301 |
| XXXV | January 28, 2001 (2000) | Baltimore Ravens | 34–7 | New York Giants | Raymond James Stadium | 71,921 |
| VIII | January 13, 1974 (1973) | Miami Dolphins | 24–7 | Minnesota Vikings | Rice Stadium | 71,882 |
| XXXVIII | February 1, 2004 (2003) | New England Patriots | 32–29 | Carolina Panthers | Reliant Stadium | 71,525 |
| XLII | February 3, 2008 (2007) | New York Giants | 17–14 | New England Patriots | University of Phoenix Stadium | 71,101 |
| 50 | February 7, 2016 (2015) | Denver Broncos | 24–10 | Carolina Panthers | Levi's Stadium | 71,088 |
| XLVII | February 3, 2013 (2012) | Baltimore Ravens | 34–31 | San Francisco 49ers | Mercedes-Benz Superdome | 71,024 |
| LI | February 5, 2017 (2016) | New England Patriots | 34–28 (OT) | Atlanta Falcons | NRG Stadium | 70,807 |
| XLIII | February 1, 2009 (2008) | Pittsburgh Steelers | 27–23 | Arizona Cardinals | Raymond James Stadium | 70,774 |
| XLIX | February 1, 2015 (2014) | New England Patriots | 28–24 | Seattle Seahawks | University of Phoenix Stadium | 70,288 |
| LIII | February 3, 2019 (2018) | New England Patriots | 13–3 | Los Angeles Rams | Mercedes-Benz Stadium | 70,081 |
| LVI | February 13, 2022 (2021) | Los Angeles Rams | 23–20 | Cincinnati Bengals | SoFi Stadium | 70,048 |
| XXXII | January 25, 1998 (1997) | Denver Broncos | 31–24 | Green Bay Packers | Qualcomm Stadium | 68,912 |
| XLVI | February 5, 2012 (2011) | New York Giants | 21–17 | New England Patriots | Lucas Oil Stadium | 68,658 |
| XL | February 5, 2006 (2005) | Pittsburgh Steelers | 21–10 | Seattle Seahawks | Ford Field | 68,206 |
| LVII | February 12, 2023 (2022) | Kansas City Chiefs | 38–35 | Philadelphia Eagles | State Farm Stadium | 67,827 |
| LII | February 4, 2018 (2017) | Philadelphia Eagles | 41–33 | New England Patriots | U.S. Bank Stadium | 67,612 |
| XXXVII | January 26, 2003 (2002) | Tampa Bay Buccaneers | 48–21 | Oakland Raiders | Qualcomm Stadium | 67,603 |
| XXVI | January 26, 1992 (1991) | Washington Redskins | 37–24 | Buffalo Bills | Metrodome | 63,130 |
| LIV | February 2, 2020 (2019) | Kansas City Chiefs | 31–20 | San Francisco 49ers | Hard Rock Stadium | 62,417 |
| I | January 15, 1967 (1966 AFL/1966 NFL) | Green Bay Packers | 35–10 | Kansas City Chiefs | Los Angeles Memorial Coliseum | 61,946 |
| LVIII | February 11, 2024 (2023) | Kansas City Chiefs | 25–22 (OT) | San Francisco 49ers | Allegiant Stadium | 61,629 |
| LV | February 7, 2021 (2020) | Tampa Bay Buccaneers | 31–9 | Kansas City Chiefs | Raymond James Stadium | 24,835 |
The Superbowl that hosted the most fans was back in 1980 when the Rose Bowl welcomed 103,985 through its turnstiles. That would be the year when the Pittsburgh Steelers would come out on top against the Los Angeles Rams after winning 31-19.
While it is the Rose Bowl that can lay claim to having four of the five highest all-time Superbowl attendances, The only non-Rose Bowl venue in the top five is the Cowboys Stadium’s 2010 Superbowl between the Green Bay Packers and the Pittsburgh Steelers.
The Green Bay Packers winning 31-25 and doing so in front of 103,219 paying supporters – a figure that sees the 2011 event rank fourth in the overall list in terms of highest attendances for the Superbowl and just 666 seats below the all-time high.
Most Superbowl Appearances

From all-time high attendances to all-time highest winners, this is where we look at those teams that have tasted Superbowl success the most:
| Franchise | Wins | Losses | Points for | Points against | Appearances |
|---|---|---|---|---|---|
| Boston / New England Patriots | 6 | 5 | 246 | 282 | 11 |
| Pittsburgh Steelers | 6 | 2 | 193 | 164 | 8 |
| San Francisco 49ers | 5 | 3 | 261 | 179 | 8 |
| Dallas Cowboys | 5 | 3 | 221 | 132 | 8 |
| Kansas City Chiefs | 4 | 2 | 136 | 150 | 6 |
| Green Bay Packers | 4 | 1 | 158 | 101 | 5 |
| New York Giants | 4 | 1 | 104 | 104 | 5 |
| Denver Broncos | 3 | 5 | 147 | 259 | 8 |
| Oakland / Los Angeles / Las Vegas Raiders | 3 | 2 | 132 | 114 | 5 |
| Washington Redskins / Football Team / Commanders | 3 | 2 | 122 | 103 | 5 |
| St. Louis / Los Angeles Rams | 2 | 3 | 85 | 100 | 5 |
| Miami Dolphins | 2 | 3 | 74 | 103 | 5 |
| Baltimore / Indianapolis Colts | 2 | 2 | 69 | 77 | 4 |
| Tampa Bay Buccaneers | 2 | 0 | 79 | 30 | 2 |
| Baltimore Ravens | 2 | 0 | 68 | 38 | 2 |
| Philadelphia Eagles | 1 | 3 | 107 | 122 | 4 |
| Seattle Seahawks | 1 | 2 | 77 | 57 | 3 |
| Chicago Bears | 1 | 1 | 63 | 39 | 2 |
| New Orleans Saints | 1 | 0 | 31 | 17 | 1 |
| New York Jets | 1 | 0 | 16 | 7 | 1 |
| Buffalo Bills | 0 | 4 | 73 | 139 | 4 |
| Minnesota Vikings | 0 | 4 | 34 | 95 | 4 |
| Cincinnati Bengals | 0 | 3 | 57 | 69 | 3 |
| Atlanta Falcons | 0 | 2 | 47 | 68 | 2 |
| Carolina Panthers | 0 | 2 | 39 | 56 | 2 |
| San Diego / Los Angeles Chargers | 0 | 1 | 26 | 49 | 1 |
| St. Louis / Phoenix / Arizona Cardinals | 0 | 1 | 23 | 27 | 1 |
| Houston / Tennessee Oilers / Titans | 0 | 1 | 16 | 23 | 1 |
| Cleveland Browns | 0 | 0 | – | – | 0 |
| Detroit Lions | 0 | 0 | – | – | 0 |
| Houston Texans | 0 | 0 | – | – | 0 |
| Jacksonville Jaguars | 0 | 0 | – | – | 0 |
Here we can see that the team currently known as the New England Patriots tops the ranking for all-time wins with six entries in that column and not only that, but it has also been on the losing end on five other occasions.
11 occasions where the Patriots have been in Superbowl action, three more than the next three teams in the list and although the trio of the Pittsburgh Steelers, San Francisco 49ers and Dallas Cowboys have each appeared eight times, the Steelers edge it with six wins instead of five.
The 49ers and the Cowboys each having won the Superbowl a total of five times each, one more than the trio of the Kansas City Chiefs, Green Bay Packers and the New York Giants who have won four each and four more than four teams who have never appeared at a Superbowl.
Highest Superbowl Win Percentage

Spare a thought for the Cleveland Browns, Detroit Lions, Houston Texans and Jacksonville Jaguars as they are still searching for their time on the biggest stage of them all and although winning in quantity is something to be celebrated, success percentage rates should not be ignored either.
| Franchise | Wins | Losses | Win % | Points for | Points against | Appearances |
|---|---|---|---|---|---|---|
| Tampa Bay Buccaneers | 2 | 0 | 100.00% | 79 | 30 | 2 |
| Baltimore Ravens | 2 | 0 | 100.00% | 68 | 38 | 2 |
| New Orleans Saints | 1 | 0 | 100.00% | 31 | 17 | 1 |
| New York Jets | 1 | 0 | 100.00% | 16 | 7 | 1 |
| Green Bay Packers | 4 | 1 | 80.00% | 158 | 101 | 5 |
| New York Giants | 4 | 1 | 80.00% | 104 | 104 | 5 |
| Pittsburgh Steelers | 6 | 2 | 75.00% | 193 | 164 | 8 |
| Kansas City Chiefs | 4 | 2 | 66.70% | 136 | 150 | 6 |
| San Francisco 49ers | 5 | 3 | 62.50% | 261 | 179 | 8 |
| Dallas Cowboys | 5 | 3 | 62.50% | 221 | 132 | 8 |
| Oakland / Los Angeles / Las Vegas Raiders | 3 | 2 | 60.00% | 132 | 114 | 5 |
| Washington Redskins / Football Team / Commanders | 3 | 2 | 60.00% | 122 | 103 | 5 |
| Boston / New England Patriots | 6 | 5 | 54.50% | 246 | 282 | 11 |
| Baltimore / Indianapolis Colts | 2 | 2 | 50.00% | 69 | 77 | 4 |
| Chicago Bears | 1 | 1 | 50.00% | 63 | 39 | 2 |
| St. Louis / Los Angeles Rams | 2 | 3 | 40.00% | 85 | 100 | 5 |
| Miami Dolphins | 2 | 3 | 40.00% | 74 | 103 | 5 |
| Denver Broncos | 3 | 5 | 37.50% | 147 | 259 | 8 |
| Seattle Seahawks | 1 | 2 | 33.30% | 77 | 57 | 3 |
| Philadelphia Eagles | 1 | 3 | 25.00% | 107 | 122 | 4 |
| Buffalo Bills | 0 | 4 | 0.00% | 73 | 139 | 4 |
| Minnesota Vikings | 0 | 4 | 0.00% | 34 | 95 | 4 |
| Cincinnati Bengals | 0 | 3 | 0.00% | 57 | 69 | 3 |
| Atlanta Falcons | 0 | 2 | 0.00% | 47 | 68 | 2 |
| Carolina Panthers | 0 | 2 | 0.00% | 39 | 56 | 2 |
| San Diego / Los Angeles Chargers | 0 | 1 | 0.00% | 26 | 49 | 1 |
| St. Louis / Phoenix / Arizona Cardinals | 0 | 1 | 0.00% | 23 | 27 | 1 |
| Houston / Tennessee Oilers / Titans | 0 | 1 | 0.00% | 16 | 23 | 1 |
| Cleveland Browns | 0 | 0 | – | – | – | 0 |
| Detroit Lions | 0 | 0 | – | – | – | 0 |
| Houston Texans | 0 | 0 | – | – | – | 0 |
| Jacksonville Jaguars | 0 | 0 | – | – | – | 0 |
Here we can see those teams that have reflected perfection when it comes to the Superbowl and although the Tampa Bay Buccaneers and the Baltimore Ravens have only made two appearances each, they have been faultless in their four combined performances.
The same perfection can also be attached to the duo of the New Orleans and the New York Jets and with them making a single respective appearance at the Superbowl, they have each managed to win their one and only show on the big stage.
As referenced above, four current teams have yet to have a dose of Superbowl fever and three have come so close but yet so far. Spare an additional thought for the Chargers, Cardinals and the Titans as they have fallen short when it really matters.
Stadiums That Have Hosted The Most Superbowls

There are always going to be winners and losers when it comes to this sporting occasions, but there is also competition in a bid to host the game itself and it is a competition that has been contested like this since 1967.
| Stadium | Location | No. hosted | Years hosted |
|---|---|---|---|
| Caesars Superdome, formerly Louisiana Superdome and Mercedes-Benz Superdome | New Orleans, Louisiana | 8* | 1978, 1981, 1986, 1990, 1997, 2002, 2013, 2025 |
| Hard Rock Stadium, formerly Joe Robbie Stadium, Pro Player Stadium, Dolphin Stadium, and Sun Life Stadium | Miami Gardens, Florida | 6 | 1989, 1995, 1999, 2007, 2010, 2020 |
| Orange Bowl | Miami, Florida | 5 | 1968, 1969, 1971, 1976, 1979 |
| Rose Bowl | Pasadena, California | 5 | 1977, 1980, 1983, 1987, 1993 |
| Tulane Stadium | New Orleans, Louisiana | 3 | 1970, 1972, 1975 |
| San Diego Stadium, formerly Qualcomm Stadium, Jack Murphy Stadium | San Diego, California | 3 | 1988, 1998, 2003 |
| Raymond James Stadium | Tampa, Florida | 3 | 2001, 2009, 2021 |
| State Farm Stadium, formerly University of Phoenix Stadium | Glendale, Arizona | 3 | 2008, 2015, 2023 |
| Los Angeles Memorial Coliseum | Los Angeles, California | 2 | 1967, 1973 |
| Tampa Stadium | Tampa, Florida | 2 | 1984, 1991 |
| Georgia Dome | Atlanta, Georgia | 2 | 1994, 2000 |
| NRG Stadium, formerly Reliant Stadium | Houston, Texas | 2 | 2004, 2017 |
| Rice Stadium | Houston, Texas | 1 | 1974 |
| Pontiac Silverdome | Pontiac, Michigan | 1 | 1982 |
| Stanford Stadium | Stanford, California | 1 | 1985 |
| Hubert H. Humphrey Metrodome | Minneapolis, Minnesota | 1 | 1992 |
| Sun Devil Stadium | Tempe, Arizona | 1 | 1996 |
| Alltel Stadium, Now EverBank Stadium, formerly Jacksonville Municipal Stadium, EverBank Field and TIAA Bank Field | Jacksonville, Florida | 1 | 2005 |
| Ford Field | Detroit, Michigan | 1 | 2006 |
| AT&T Stadium | Arlington, Texas | 1 | 2011 |
| Lucas Oil Stadium | Indianapolis, Indiana | 1 | 2012 |
| MetLife Stadium | East Rutherford, New Jersey | 1 | 2014 |
| Levi's Stadium | Santa Clara, California | 1 | 2016 |
| U.S. Bank Stadium | Minneapolis, Minnesota | 1 | 2018 |
| Mercedes-Benz Stadium | Atlanta, Georgia | 1 | 2019 |
| SoFi Stadium | Inglewood, California | 1 | 2022 |
| Allegiant Stadium | Paradise, Nevada | 1 | 2024 |
*Data inclusive of upcoming 2025 game
Top of the tree is what is now known as Caesars Superdrome and with them ready and waiting to stage this year’s edition of the Superbowl, its 2025 hosting will be it pulls further clear with eight individual hosting duties.
Two more than what is currently known as the Hard Rock Stadium and three more than legacy venues the Orange Bowl and the Rose Bowl who have not staged a Superbowl since 1979 and 1993 respectively.
Then again, the Superbowl is certainly a future-facing event and likes to spread out hosting duties where it can – something that is signified by eight new venues being given such an important task since 2011.
Most Watched Half-Time Shows Since 2012

An important task that also has to host such an important show at half-time and although musical tastes have evolved over the decades, only the best of the best get to whip up the thousands in attendance into a frenzy.
| Year | Superbowl | Performer(s) | Viewership (Millions |
|---|---|---|---|
| 2012 | XLVI | Madonna | 114 |
| 2013 | XLVII | Beyoncé | 110.8 |
| 2014 | XLVIII | Bruno Mars | 115.3 |
| 2015 | XLIX | Katy Perry | 118.5 |
| 2016 | 50 | Coldplay, Beyoncé, Bruno Mars | 115.5 |
| 2017 | LI | Lady Gaga | 117.5 |
| 2018 | LII | Justin Timberlake | 106.6 |
| 2019 | LIII | Maroon 5 | 98.2 |
| 2020 | LIV | Shakira and Jennifer Lopez | 104 |
| 2021 | LV | The Weeknd | 96.7 |
| 2022 | LVI | Dr. Dre, Snoop Dogg, Eminem, Mary J. Blige, Kendrick Lamar | 112 |
| 2023 | LVII | Rihanna | 118.7 |
| 2024 | LVIII | Usher | 129.3 |
A who’s who of contemporary musical talents has been on show since the start of the decade but it is not just these names that have drawn huge audiences in the past. For example, Michael Jackson’s performance during Super Bowl XXVII remains the most-watched halftime show on television
This particular performance drew a staggering audience of over 133.4 million viewers across network television and the current crop of musical superstars have not been far off from reaching that figure themselves.
If we take a look at the viewing figures of the half-time show since 2012, they return these hefty numbers:
Then again, it is not all about network television these days and with technological advances happening at such a pace, there are now plenty of other ways to keep your eyes on the Superbowl.
On digital platforms, the Super Bowl LIV halftime show starring Shakira and Jennifer Lopez set a new benchmark, becoming the most-viewed performance on YouTube with over 318 million views on the NFL’s official channel.
While in what must be considered a groundbreaking moment, the Super Bowl LVI halftime show, featuring Dr. Dre, Snoop Dogg, Eminem, Mary J. Blige, and Kendrick Lamar, became the first halftime performance to win a Primetime Emmy Award for Outstanding Variety Special (Live).
In addition to that, Lady Gaga’s Super Bowl LI performance earned a record six Emmy nominations, the most for any halftime show, and secured a win for Outstanding Lighting Design/Lighting Direction for a Variety Special.
These achievements underscore the halftime show's evolution into a pinnacle of entertainment, blending music, performance, and global appeal and there will also be a huge appeal when it comes to betting on Superbowl 59.
The 10 Most Bet On Superbowls

| Rank | Year | Amount Wagered |
|---|---|---|
| 1 | 2024 | $ 185.61 |
| 2 | 2022 | $ 179.82 |
| 3 | 2018 | $ 158.59 |
| 4 | 2020 | $ 154.68 |
| 5 | 2023 | $ 153.18 |
| 6 | 2019 | $ 145.94 |
| 7 | 2017 | $ 138.48 |
| 8 | 2021 | $ 136.10 |
| 9 | 2016 | $ 132.55 |
| 10 | 2014 | $ 119.40 |
| 11 | 2015 | $ 115.99 |
| 12 | 2013 | $ 98.94 |
| 13 | 2006 | $ 94.53 |
| 14 | 2012 | $ 93.90 |
| 15 | 2007 | $ 93.07 |
| 16 | 2008 | $ 92.06 |
| 17 | 2005 | $ 90.76 |
| 18 | 2011 | $ 87.49 |
| 19 | 2010 | $ 82.73 |
| 20 | 2009 | $ 81.51 |
| 21 | 2004 | $ 81.24 |
Last year (2024), The American Gaming Association (AGA) estimated that $23.1 billion was wagered on the Super Bowl in the United States, which included bets placed through legal sportsbooks, illegal bookies, and informal wagers.
Of this, approximately $1.25 to $1.5 billion was wagered through legal U.S.-based sportsbooks, reflecting the growing acceptance and regulation of sports betting in the country and it is believed that figure will only grow further in a few weeks.
Some notable individual wagers made headlines during the event, such as a $540,000 bet on the Chiefs +4.5 line by a Michigan gambler, a $1 million bet on the 49ers money line, and a $100,000 wager on the coin toss landing 'tails.’
If fans are really convinced about picking a winner, or by a winning margin, they can also utilise spread betting for a chance to win even more, depending on how right you are. Historically, Super Bowl winners have had a strong record against the spread (ATS), with teams winning the Super Bowl covering the spread 87% of the time. This trend has been even more pronounced since the 2009 season, with a success rate of 92.9%.
For Super Bowl LVIII, the over/under line was set at 47.5 points. The final combined score was 47, resulting in a push for bettors, with an almost even split historically between the number of overs and unders in Super Bowl games.
The rapid increase in wagering, particularly through legalised channels, highlights the growing popularity of sports betting in the U.S and with such a huge audience and also suggests there is greater consumer confidence when it comes to betting on huge sporting events.
Events that certainly get no greater than the Superbowl and it will be interesting to see what records can be broken in 2025.
Sources
https://en.wikipedia.org/wiki/Super_Bowl
https://www.sportsboom.com/betting/how-much-was-bet-on-the-superbowl-2024-in-the-usa/
https://www.dimers.com/news/super-bowl-2024-betting-trends-fact-and-player-stats-to-know
https://www.statista.com/statistics/271778/money-wagered-in-nevadas-sports-books-on-the-super-bowl/
https://en.wikipedia.org/wiki/Super_Bowl_LV_halftime_show
https://www.statista.com/statistics/1358018/most-watched-super-bowl-halftime-shows-tv/
https://www.statista.com/statistics/271778/money-wagered-in-nevadas-sports-books-on-the-super-bowl/
