You know how punters get lost in too much data or bet blindly? I break down the stats and trends so you can feel confident you’re betting with more than just gut instinct.
At OLBG we help millions of sports bettors to find winners through our betting tips.
In particular we have some amazing horse racing tipsters who are consistently profitable with their horse racing tips.
But what if you want to choose your own winning bets?
What strategies, systems and methods will help you to find a winning horse racing bet?
This is what our members have been discussing for more than 20 years on the OLBG forums and betting blogs.
Our horse racing experts have been sharing their secrets, testing their methods and discussing their strategies.
Now we reveal the secrets through this guide to over 101 different methods which you can use to find a winning horse racing bet.
Unlock Your Winning Streak: 101 Expert Horse Racing Tips to Boost Your Bets!
Profiling Horses - How to spot a winning horse
Using past winners of the race to understand the right profile
1. What type of horse wins a race like this?
Each type of horse race will be suited to a certain type of horse. Understanding the profile of winners in races like the one you are looking at will help you to identify the most likely winner.
This will require some detailed research, compiling data for the specific race type you are interested in.
Horses for Courses
2. Using 10 year Winner Trends
Ten-year trends of past winners of a specific race are very popular as they help to identify the type of horse which has won this specific race in the past.
There are many trends blogs that have been written by the community here at OLBG. We make sure that blogs are available for all the major races during the season which include lists of past winners and their trends.
You can use these to help you to narrow down the field. For example, the 2020 Gold Cup Winner, Al Boum Photo, met 8 of the 10 trends we identified in our Cheltenham Gold Cup Preview
3. Repeat Performance - Horses Running in The Same Race Again
One theory that some successful horse racing punters follow is “never back a horse to do something it hasn’t done before”. Taking this further, how about backing a horse to do exactly what it has done before?
Some racecards will include information about the winner of the race last year.
Other sources go further to list all entries in this year's race that has run in the race in any previous year. If not, it isn’t hard to look through the runner's form for the same period last year.
Horses going for a “repeat performance” is a great way to spot possible winners as often horses are aimed at races they have won or run well in before.
The connections already know that the conditions of the race suit them so it makes sense to target the same race again.
Below are some recent horses that achieved this, but there are many more both in championship races and in lower grade contests.
| Horse | Race | Repeat Wins |
|---|---|---|
| Quevega | Mares Hurdle - Cheltenham | 2009,2010,2011,2012,2013,2014 |
| Stradivarius | Goodwood Cup - Goodwood | 2017,2018,2019,2020 |
| Trueshan | Long Distance Cup - Ascot | 2020,2021,2022 |
| Tiger Roll | Cross County Chase - Cheltenham | 2018,2019,2021 |
| Enable | King George V1 and Queen Elizabeth Stakes - Ascot | 2017,2019,2020 |
4. Separating horses performances by race type
When studying the form of an individual horse you can separate it’s performances out by many of the criteria mentioned on this page.
The more you do this, the more you will start to see horses who perform well in certain race types and poorly in others.
When the form is all written in one straight chronological line it isn’t so easy to identify this.
If however, you find a horse that runs well in a certain race type but hasn’t been entered in that type of race for a few runs, you can often find a great value bet - e.g: returning to the All Weather from the grass.
The horse won't have been running well for a reason and now returned to its favoured race type, it could well show much-improved form. This is a great way to spot good value betting opportunities as well as finding winners.
5. The Paddock Picks - how to spot a fit horse
Paddock watchers are a dying breed but there are still some out there who will travel the racecourses using their skills of being able to spot a fit racehorse to try and gain an edge.
In certain types of races such as 2 year old races and hunter chases, early season races, understanding which horses are fit is a huge advantage.
Researching and understanding what to look for in the paddock could give you a distinct advantage of the average punter
Horses For Courses & Understanding Course Characteristics
Many everyday sayings have come from horse racing.
This one isn't just a nice saying but very much a winner finding angle.
Horses for courses have stuck around in our language for a reason, some horses perform better at certain courses.
There are many reasons for this and some of these reasons are winner finding tips in their own right
6. Horses who perform better on left or right-handed courses
Some runners will only perform well running a certain way around a course.
Some horses may have all wins next to its name on right hand courses, and some may have never won on left handed courses.
Look for patterns when checking the form book.
| Left Handed RaceCourses | Right Handed RaceCourses |
|---|---|
| Aintree, Ayr | Ascot |
| Bangor, Bath, Brighton | Beverley |
| Cartmel, Catterick Cheltenham, Chelmsford,Chepstow, Chester | Carlisle |
| Doncaster | Exeter |
| Epsom | Hamilton, Hereford, Hexham, Huntingdon |
| Fakenham, Ffos Las, Fontwell | Kempton |
| Great Yarmouth | Goodwood |
| Haydock, | Leicester, Ludlow |
| Kelso | Market Rasen, Musselburgh |
| Lingfield | Newmarket |
| Newbury, Newcastle, Newton Abbot, Nottingham | Perth |
| Plumpton, Pontefract | Ripon |
| Redcar | Salisbury, Sandown |
| Sedgefield, Southwell, Stratford | Taunton |
| Thirsk | Warwick. Wincanton, Windsor |
| Uttoxeter | |
| Wetherby, Worcester, Wolverhampton | |
| York |
For further detailed information on all UK racecourses please visit the the UK Racecourse Pages and scroll down.
Those detailed pages include a map of the course, statistics, jockey and trainer information, big race trends and contact information.
Some horses may lead with their left legs, others with their right. Some may feel unbalanced going a certain way.
If you watch jump races you may have seen some horses jump out to the right on a left-handed course or the other way round.
Look through the form of a runner, understanding its performance on left or right-handed tracks.
- Which way round was the horse running when it achieved it’s best performance?
- Do the race comments or better still, video replays, indicate a preference?
- Has a horse run well going the “wrong way” and does that indicate it is ready to win when returning to its preferred way?
Left or Right Handed Runner?
7. Horses which prefer flat or undulating courses
Some horses for courses preferences are less easy to understand.
Sometimes a horse may not run well for no obvious reason. That is until you understand the course characteristics.
Some horses just don’t like running up and down hills, needing to change their stride regularly, they would much rather run on a flat course and keep the same stride.
Learn which courses are undulating (classic examples being Cheltenham, Carlisle and Exeter).
Course Condition Info
8. Horses which run better on tight or galloping courses
In a similar way, some horses prefer tight or galloping tracks. As well as preferred stride reasons, this could be because a horse is particularly favoured by taking a lead or finishing strongly.
Here are some blogs which look at this in more detail
Read Here
9. Using draw bias to find good bets
Identifying horses drawn well in short flat races especially has been a great way of finding value bets in the past.
The more that is known about draw bias though, the less of an edge that may occur.
New courses, new surfaces, changes in start position, movement of rails, changes in going, changes in drainage methods, could all mean a change in the degree of course bias.
So keeping a record of performances from different stalls could be a good way to identify good bets.
At some courses a wide draw or an inside draw hamper the chances of a horse winning.
Beverley and Chester are two flat courses where you always need to check the draw in races of a mile or less.
10. Course Favourites
Does the favourite win more often at some courses rather than others?
One member noticed a lot of favourites winning at Wincanton, whereas another identified that more tend to win at Ludlow.
An interesting angle which may well be worth exploring. Perhaps some tracks are less competitive than others. Maybe some tracks are more likely to produce truly run races so less likely to see shocks.
Courses That Favourites Win Often
11. All weather racing tips require a unique approach
Many of our horse racing experts will argue that betting on the all-weather needs a unique approach. In many case horses that run well on grass do not transfer their form to the All Weather.
It is best to look for form on the surface before placing your bet.
12. All-weather track biases
Each of the all-weather tracks has their own unique characteristics. Our Lingfield tips page includes some research into track bias there. It suggests that a low draw has an advantage.
Course Info for all-weather tracks
- Lingfield Course Guide & Tips
- Chelmsford Course Guide & Tips
- Newcastle Course Guide & Tips
- Kempton Course Guide & Tips
- Southwell Course Guide & Tips
- Wolverhampton Course Guide & Tips
13. Track Surface Biases
The surface at courses varies at individual courses.. Again, the more information you can research about the course and understand it better, the more advanced position you will find yourself in to make betting decisions based on the preferences of the runner taking part in the races.
14. Dropping In Handicap Mark & Returning to Ideal Conditions
For this one we will let OLBG member Jeremiah Catskill explain using an example.
This alternative blog looks at Finding Horse Racing Handicap Winners.
Finding Horse Racing Handicap Winners - A Few Ideas
15. Identifying when Horses Meet Their Ideal Class
If you can find a horse that should be running in a higher class race, running against horses who should be running in a lower class race you may well have found yourself a nice bet. This isn't as hard as it may sound. OLBG Member Jeremiah Catskill said
Monster agreed
16. Handicap Top Weights
A similar approach to the last two posts, identifying horses in a better class. The simple method here though is to look at the top weights for each handicap taking place today.
Ideally find top weights a little above the other runners, i.e. with a gap in weight of a few pounds.
Take a look at that runner's recent runs and understand if it has been running in higher class races. This could be determined by the race class, the handicap range or the prize money.
You are looking for a runner who has won or been very close to winning in the current class of race in the past and has since been running in higher class races. Ideally running well in those races but not winning.
This is likely to it being outclassed in that race. You will often see it has been outpaced whereas in previous races in today's class or below it hasn’t been outpaced.

Class can also be looked at in terms of race pace. Higher class races are run at a faster race.
If a horse is pushed into running above a comfortable race pace it will struggle, use up too much energy and tire. Dropping back down to a comfortable race pace against horses of a lower class can often see these types of horses get back to winning ways.
Finally it is the trainers job to identify which of his horses should run in which race. He thought the horse good enough to run in a higher class race so it figures that he must think that it has a very good chance in a lower class race.
17. How to find favourites likely to be outclassed
A quote from OLBG Member Jeremiah Catskill on identifying poor value favourites from recent handicap winners looks at the reverse of the above principle but particularly where you can identify fortunate winners in handicaps.
Perhaps they wouldn't have won in that lower class if they hadn't had their ideal conditions.
Maybe other runners were unfortunate. Now that horse is raised in class (ie running at a faster pace) and maybe without it’s ideal conditions this time it may well be outclassed.
Remember handicap favourites only win around 30% of the time, so 7 out of 10 lose.
18. Analysing Favourites
Long standing OLBG member nors loves to analyse favourites. In fact he has been doing so on the OLBG blogs since 2012.
Take a look at his 2020 version of horse racing favourites to discover angles to back or lay favourites.
19. How to find strong favourites

A starting point for many is to try and oppose short price favourites. You will find situations where you really can't “get the favourite beaten”.
Strong favourites without an apparent strong opponent can be great bets.
It all depends on the odds available and how likely they are to win of course. The market may still offer such runners at a good price.
20. Creating Speed Ratings
The fastest horse wins the race right? Understanding speed ratings, how they are calculated and even how to create your very own ratings could give you an edge.
Shorter races (5f,6f,7f) would be a good staring point for your speed study's.
21. Easy last time out winners
If a horse wins a race very easily then it may well be able to follow up with another win soon. Horses with a win next to their name do have a higher strike rate than those without one.
Look to identify easy winners who didn’t have hard races, returning to the track again to run in similar company.
In 2022 around 20% of horses won back to back races.
22. What Makes a Classy Chaser
Here is another well known saying that comes from horse racing “form is temporary, class is permanent” Here one OLBG member seeks to understand the type of horses that win grade one chases.
List of Grade 1 Chases in the UK, all these races are covered individually on OLBG.
| Course | Race | Month |
|---|---|---|
| Haydock | Betfair Chase | November |
| Sandown | Henry VIII Chase | December |
| Sandown | Tingle Creek | December |
| Kempton | Kauto Star Novice Chase | December |
| Kempton | King George V1 | December |
| Ascot | Clarence House Chase | January |
| Sandown | Scilly Isles Novices | February |
| Ascot | Ascot Chase | February |
| Cheltenham | Arkle | March |
| Cheltenham | RSA Chase | March |
| Cheltenham | Queen Mother Champion Chase | March |
| Cheltenham | Ryanair Chase | March |
| Cheltenham | Gold Cup | March |
| Aintree | Bowl Chase | April |
| Aintree | Melling Chase | April |
| Aintree | Maghull Novices | April |
Beating the Handicapper
One way of how to find winners in horse racing is to identify when a runner is 'ahead of the handicapper'.
Here are some things to look for
23. Horses which don’t need a long recovery
Days since a horse last ran or days since last time out (LTO) are an important factor to consider when analysing horse racing form.
Horses who have tough races can lose a lot of weight and take weeks to recover fitness. But also horses can need racecourse runs to reach full fitness.
In fact, there are stats to show that horses which have won very recently can often go on to win again
Read these Statistics on LTO Runners
24. Quick returns to avoid a higher handicap mark

The above stats may not just be about fitness, if a horse runs again before the handicapper has time to assess their mark, they could be on a very good handicap mark.
To try and tackle this issue, a horse is given a penalty if it wins and then runs again before a new mark can be allotted. But often that penalty isn’t enough.
25. Well entered for a quick repeat
Some trainers specifically aim for their horses to win two races in quick succession to take advantage of running again under a penalty rather than a new handicap mark.
You can notice these tactics when you look at the entries a horse holds. If a horse is very well entered in multiple races after today’s race, it could be a sign of a trainer's intention to run their horse again soon under penalty.
How to Find Winners in Horse Racing using Trainers
There are some signals that can mean runners have a higher chance than perhaps the odds are showing. Tracking trainer trends and statistics as well as signals in terms of habits that yards employ in the search for winners, could help identify potential winning bets.
26. Trainers with Course form
Analysing trainers statistics by course can provide interesting angles. Trainers will have their own favourite tracks and perhaps through habit or particularly liking a track they may well have a better record with runners at this track.
27. Long Distance Travellers
If a trainer has an entry at a course a long way away that can be a good sign.
Why would they travel that far with all the costs of getting to the course?
If a trainer is just looking to get a run into their horse then typically they will do so at a local track. So a good sign is to look at long distance travellers.

28. Overseas Raiders
Extending this further, it would be rare for a trainer to travel to another country to run a horse if they didn't really fancy their chances of collecting the prize money.
Many a good bet has been found following overseas raiders. Perhaps from France, Germany or Ireland going to a UK track.
29. Trainers by month

Each trainer will have their own process which works for them. Some will bring their runners in from their winter or summer rests earlier.
Top trainers will target the big racing festivals around the spring. Smaller trainers will have to find their niche. This may mean running their horses before the big guns are out, or late in the season once the better horses have run.
Looking at trainer records by month is a profitable method. OLBG member scratville has been using this method for years and each month provides the community with stats for trainers to follow.
You can take a look at these monthly blogs here Horse Racing trainers To Follow
30. Trainers by race type
Each training yard needs to find its niche if it is to be a profitable business.
Only a very few top yards can just focus on the big races. Aside from focus, each yard will have training facilities that suit different types of runners. Certain yards may be suitable for more endurance work, if a national hunt yard is near flat gallops, maybe it has the ideal facilities for training speedier horses.
Trainers who do well in national hunt flat races.
31. Follow a stable or stables
A fantastic way to find nice winning bets is to follow a stable. Choose a stable local to you or one which trains the types of horses you like to watch. Alternatively, analyse the winners to horses ratio - ie how many separate horses a trainer wins with. If a trainer can get a win from most or all horses they train that is a good sign of a great trainer. Those who used this tactic would have been following Richard Newland many years before others realised how good a trainer he was.
32. Bank Holiday Trainers
There are many different factors you could pick up on once you start following trainers and understanding trainer stats. OLBG member Teddy T has looked at trainers with good records on bank holidays.
33. Multiple entries at minor meetings
When a trainer has a horse that is ready to win they want to make sure it gets a run. This may lead to multiple entries and is a good sign of when a trainer thinks their runner will win rather than just getting a run into a horse (less likely to be well entered)
We are lucky to have so many shrewd punters here at OLBG and this subject of horses with multiple entries has been well covered and tracked
Using Form to Find Winners in Horse Racing
34. Poor value favourites
With the use of betting exchanges, finding losers can be as profitable as finding winners. How to analyse poor value favourites and laying them on the exchanges is an often-used strategy, in finding losers to profit from horse racing.
Find false favs
35. Unpredictable races and laying places
Unpredictable races are a treasure chest of opportunity. from the bigger priced winner, to poor performing short-priced favourites. The key is in being able to identify races that could turn out unpredictable.
Laying places on betting exchanges can be a lucrative low-risk strategy to making profit from betting on horse racing.
Taking short-priced favourites in races of 7 runners or less, provides only 2 places for them to finish. you will often find runner available to lay at shorter than 1.30, failing to find the first 2 places.
36. Harvesting winners from top races
A very simple system that has been written about on OLBG many times is looking at the runners in the champion bumper at the Cheltenham Festival and following them going forward.
This relies upon the principle that a horse has to be very good and likely very well bred to run in the Champion Bumper. If so, then this pool of horses are likely to be successful over their national hunt careers.
In the 2023 Champion Bumper at Cheltenham there were twenty one runners, by the time we reached December 2023 sixteen of those runners had won a subsequent race, including the 11th, 12th and 14th finishers who had won twice.
37. The 3YO handicap system
Using betting systems is an entire subject within itself, and we have a betting systems section dedicated to the art.
For reference, OLBG Blogger Monkey Tennis revealed his profitable racing system which identifies top 3YO handicaps and followers horses from these.
38. Specialising and finding your niche
Just as Monkey Tennis has done on the last tip, finding your own niche and specialising can give you an edge. If you know more than most people about a particular area, perhaps high class staying chasers, or sprinters on the all weather, you will be well positioned to identify good bets. What is your niche?
39. Using form ratings
Form ratings are an easy way to be able to quickly analyse a race. Many a winner finding system has been attempted using form ratings.
There are many different form rating services available for free. You can use one on its own or combine more than one to come up with your own bespoke system
This blog looks at one source of form ratings and how they can be used to find a profitable angle.
40. Using Speed Ratings
Research on speed ratings shows that following the horse with the best speed rating won’t lead you to profits.
Although very few systems following selections blindly, will be profitable especially over a large number of bets.
Using speed ratings needs to go a lot deeper than this and combined with some of the other winner finding methods on this page.
Many have found great bets by noting fast runs from speed ratings when conditions didn’t suit or slow runs that produced what looked to be impressive winners, but on the clock, suggests an easy run race.
41. What can we learn from sectional timing?
There seems to be much more interest amongst OLBG members in the benefits of sectional timing. This can help to identify horses who finished strongly off a strong early pace - a sure sign of great fitness. Or poor winning favourites who won with a fast finish off a very slow run race, perhaps indicating weaker form.

42. Spotting falsely run races
A falsely run race in horse racing can be one where a runner has sprung from the start and had everything else chasing at the wrong pace throughout throwing up a strange result, or conversely a race where no runner wanted to lead and thus was slow and turned into an unnatural sprint finish.
The results sit in the form lines of every runner and subsequent competitors, so being able to identify when a race has been falsely run and thus affecting form can be a key element to getting an edge over other punters.
43. Race pace understanding to find winners
Race pace is covered in this blog that attempts to identify how race pace can be used to find winners through looking at one particular source of race pace information.
44. Creating your own speed ratings
Whatever you think of the benefits of speed ratings, you will learn a huge amount about studying the form of horses if you have a go at compiling your own ratings.
Using Race Comments to Find Horse Racing Winners
Many a winner finding system has been sought through looking at the comments of race readers shown in the official race results.
Of course you can understand much more about how a horse ran by watching a reply of the race. Race replays are freely available these days. But just by picking out certain words from race comments can help to identify possible winners. Here we look at some of those and how they can be used.
45. Held up
A horse which is held up, or run towards the rear of the field is often done so confidently in the knowledge that they have good stamina for the race and may finish well.
Conversely, if they have good stamina for the race, they may not be suited by running very fast at the start of the race, with connections preferring to save their energy for the finishing stages.
OLBG members have many systems and this one is based on a hold up horse system
46. Ran well
A telltale sign of a horse which ran well! But how much does such a comment impact on future race performance, and does the shorter price take into account the comment that it ran well previously.
47. Quickened
Horses which actually quicken at the end of the race are very rare sights indeed. Horses typically slow and what you may see if a horse appears to quicken, is really it slowing at a slower rate than others around it. Racing experts will know this and therefore will refrain from using such a term. So the comment of quickening is therefore quite rare to see in the form book. It can also be used during the race though to show a turn of pace. Again such an action in a genuinely run race would be rare so a horse that is quickening at any stage may be showing superior class.
48. Finished strongly
Perhaps a level less than quickening. A horse which seems to have a lot of energy at the end of a race perhaps indicates it is far superior to others in a race. Imagine yourself in a running race with the ability to finish very strongly. A sign you were comfortable and could have run at a faster pace before the end. Look out for finishing strongly in race records.
49. Ran Green
Running green refers to horses showing inexperience. They could fail to settle, pull hard, wonder, flash their tales. A horse which runs green will use up a lot of energy in doing so and will normally tire towards the end of a race. If a horse runs green and finishes well, it suggests it could run a lot better with experience and not using up that energy.
50. Trouble in running
A horse which runs well after meeting trouble in running is an obvious one to note. Using up energy during the race and running well indicates a horse which can run better than the bare form will show.
Trouble in running could include being boxed in and having to run round horses, being bumped, running into a group of horses and having to be pulled back or check stride when making an effort.
In jumps racing you could look out for mistakes at fences, other horses running into each other and anything else which could use up energy in a race. If a horse meets this sort of trouble and runs well, then without the trouble they should run even better.
A-Z of Betting Terms
Create Your Own Odds to Find Winners
Bookmakers do not always get the odds right. if they did, the favourites would always win right? - So why not have a go at creating your own odds based on the way you read the form, and look for value when there is parity between your odds and probability against the bookmakers.
51. Creating Your Own Tissue
This is a huge subject and to go in depth here would take up to much space, so try one of the suggested links below
In theory every runner in every race has a chance of winning.

What is that chance and what are the odds you can get?
That is value betting and a great way to understand this better is to learn how to compile your own tissue (what you think the odds for each runner in the race should be)
How to make your own odds
Following Jockeys
52. Course Jockeys
Do Jockeys do better at certain courses than other courses? A check of their percentage of winners by course should point us to which courses they excel at.
There may be a variety of reasons including jocks who ride for specific trainers but most of us have favourite lists, so you should expect that individual jockeys will prefer particular courses, and subsequently do well at their favoured courses.
Jockey Course Statistics
53. Jockeys in form
You can check which jockeys have ridden the most winners in the last two weeks.
Many jockeys have a purple patch each season and although this may be a coincidence it can point to their agent selecting the correct mounts, or the agent fielding a lot of requests from trainers for the “in form jockey, this just extends the good form of the jockey.
54. Jockey Ratings
How much time and effort one might put into jockey ratings is a personal choice. Certainly, there are resources whereby jockey performances are recorded and a rating given. It could be considered subjective based on type of race, venue class and competition. Putting a good jockey on a bad horse will not provide a certain winner, and likewise, an inexperienced jockey on a top-class horse is not going to make the horse bad.
How you use, if at all, jockey ratings is your choice.
55. Jockeys with one ride
If a jockey has been booked for only one ride then it can be significant, especially if the jockey is one of the top 10 jockeys that season OR a claiming jockey has been booked to take off some weight from the horse.
With travel costs these days it can be expensive for the jockey to travel for just the one ride so he or she has to recoup some of those travel costs by riding a winner. Around 10% of races are won by one trick jockeys.
56. Trainer/Jockey Combinations
Many of the top trainers have “stable jockeys” who are retained to always ride their horses.
You will often see these T and J combinations towards the top of the T and J tables.
What is more interesting is researching T and J combinations with a high percentage strike rate when they come together.
It is an important piece of the winner finding jigsaw and should always be noted.
57, Significant jockey bookings
When a trainer books a jockey who rarely rides for them you should investigate as to WHY he has gone down this route. It can be a way of narrowing down the field.
58. Pedigree
The breeding and pedigree of horses can point you in the right direction to winner finding, the top sires such as Galileo, who sired Frankel, produce winner after winner.
Galileo offspring have won over 1000 races, including 92 Group 1 winners.
59. Handicap Mark
The handicap mark is a rating by the official handicapper of a horse's performance. This mark entitles them to enter certain bands of races. By understanding handicap marks you can deduce which horses are well handicapped based on past performances. It is an integral skill in winner finding.
60. The beating starting price strategy
Starting price is the best way to predict the outcome of a race. By the time the market has had its say, it finishes with a pretty good idea of the most likely winner.
One idea to win at betting horses is simply to beat that SP by 20% or more consistently. The theory being if SP is accurate, beating it by a good amount will get you a profitable margin.
That is not to say that all horses will finish in order of the betting of course. there are exceptions but this theory works on the basis of being able to get better prices constantly. Not easy!
62. Market Moves
Market moves are most closely associated with horse racing but can be considered in many sports. When a bookmaker has made a decision to shorten a horse in the betting (E.G 5/1 into 7/2) then this can indicate that the bookie thinks the horse has a decent chance of winning. It is not an exact science and the whole of the betting market needs to be taken into consideration.
63. Steamers
A steamer is a horse that “steams” into a much shorter price (5/1 into 6/4) and is a strong market mover.
64. Drifters
The opposite of a steamer is called a drifter. [The price is drifting out in the betting] This is a horse that had started at a shorter price than its current price. ( 7/2 out to 5/1)
Betting Odds Explained
65. Using the bookies knowledge

The bookmakers generally have the best information on a horses chance, they glean this info from a variety of contacts within stables + can clearly see which horses are being bet on and which horses are being ignored.
The bigger bookmakers tend to have the best contacts and would normally see the biggest bets, therefore when they open up a betting market it is worth your while checking which bookmakers have the shortest price compared to its main rivals. Then follow those prices up to the opening show to see the variation of odds.
A good check would be to compare and contrast the likes of Bet 365, Betfair Ladbrokes and William Hill.
65. Previous market moves
If a horse moved in the market on previous occasions then someone (the owners, trainer, bookmakers) rated its chances. Look at the makeup of that race and what happened in the race and consider that market mover in this race.
Tricks of Each Way Betting:
Betting each way is a very popular activity especially when looking at horses available at bigger prices. Given that a place will get at least stake back when betting at odds of 4/1 or greater. It's not a sure fire way to profit, but can be a part of a strategy to find winning bets, if not winning selections, especially in horse racing.
66. Each Way Thieving
This saying is often used when in a 8 runner race that pays 3 places you find a horse that can come 2nd or 3rd, its especially prevalent when there is a short priced odds on favourite. The odds in the race may look something like this:
- 4/6
- 9/1
- 10/1
- 12 /1
- 20/1
- 25/1
- 33/1
- 50/1
You can back any of the 7 odds against horses each way and make profit if they place.
67. 16 runner handicap each way betting
Bookmakers pay 1-2-3-4 a ¼ of the odds in 16 runner handicaps because the races are so competitive many of the bookmakers offer more places so that you bet with them.
Paddy Power tends to do this most and could pay 1-2-3-4-5-6 in big Saturday 16 runner handicaps or handicaps at big meetings.
68. Fields cutting up - how to get more places than you should
When a race reduces the number of runners say from 8 to 7, or 16 to 13 bookmakers have been known to stick to the number of places paid, as a goodwill gesture.
By allowing the original 3 or 4 places you can benefit if you can find a horse to place.
The Betfair Exchange still pays the same number of places however may runners line up, although the odds are reduced.
Identify a horse reaching its peak
69. Finding winners by the age of a horse
As horses age, they typically lose speed and gain stamina.
This is why you see 2-year-olds running over 5 furlongs and 10-year-olds performing well in staying chases.
National Hunt horses typically reach their prime, when they will put in their best performances between 7 & 9.
Although it isn't necessarily on actual age, racing age can impact this. French national hunt horses typically start racing younger. Here one OLBG member started to look at characteristics of grade one chase winners in horse racing.
This only touches the surface, much more detailed analysis could put you on to some nice bets.
70. Number of runs - trends based runs when a horse peaks
Another method to understand when a horse is reaching its peak would be to look at the number of runs.
Typically a staying chaser will reach its around 10 chase runs. This is when it will have enough experience but not be over races. Compiling the stats and analysing this could well put you on to some good bets.
How to read racing form
71. Using Ratings
If you don’t have the time to study the form in full yourself then using a rating service can help you to quickly weigh up the chances of the runners in the race.
OLBG member Robmull looks at how useful one of those rating services is and how it can be used to create a winner finding system.
72. Weight for age allowances and three-year-olds
Many of the allowances in racing haven't been reviewed for years and often we have discussions in the OLBG forums as to whether they are fair or not.
One significant allowance is the 3-year-old weight for age allowance. Here OLBG Member nellberg looks at this and starts to discuss whether three-year-olds do have an advantage in weight for age allowance handicaps.
73. Mares allowances in National Hunt Racing
The mares national hunt program has progressed a huge amount over recent years. Perhaps partly thanks to OLBG’s sponsorship of top mares races over an 8 year period!
The prize money can be very good for mares races but many trainers are tempted to run their mares against geldings and take advantage of the weight for age allowance.

The Cheltenham Festival 2020 saw several mares win races using this allowance which arguably they may not have won without.
This started the discussions around whether the allowance is too generous or even if it should be removed altogether. When this sort of discussion is taking place, punters should take note. If it is possible that mares are getting an unfair allowance, does that make them a good bet?
74. Females v Males in All Weather Flat Racing
A detailed analysis of the stats by OLBG member martinr suggests that eliminating females in betting systems can improve their profitability.
The figures from the tables in this blog do show a bias against Fillies and Mares when racing against Males on the All Weather.
I'm a fairly avid follower of betting systems, and I've noticed that when eliminating all females from system qualifiers the profitability of the system improves.
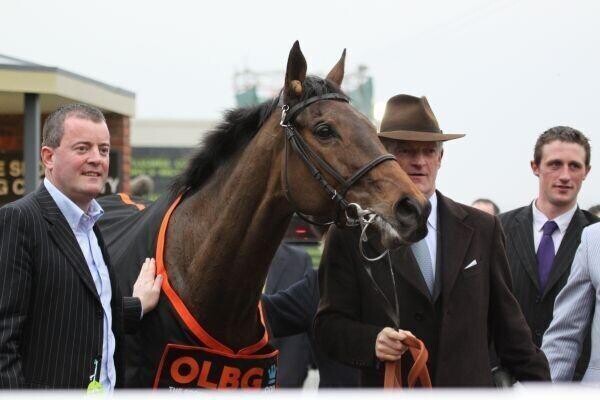
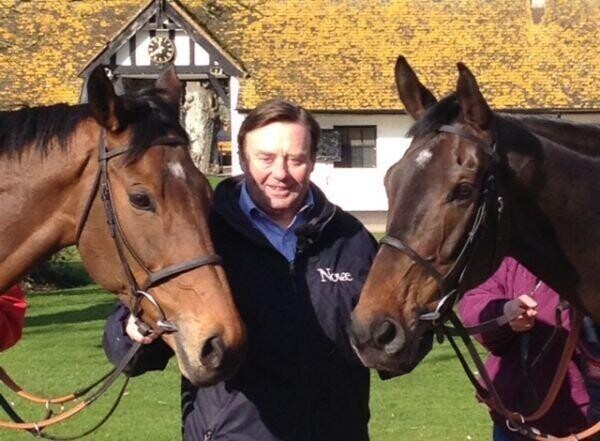
75. Consider Big Odds Runners From Top Trainers
The top trainers from both codes of horse racing should not be forgotten just because they have a runner in the race at big odds.
We looked at the seasons between 2018 -2022 and found big priced winners for Nicky Henderson (20/1 and 33/1), Paul Nicholls (25/1 and 33/1) for National Hunt Racing, both those big names also had 50/1 winners in 2023.
On the flat between 2018 and 2022 winners for William Haggas (20/1 and 33/1) and John Gosden (20/1, 25/1) + in 2023 Haggas had a couple of 20/1 winners.
In the same period Irish Champion trainer Willie Mullins had four 20/1 + winners.
Many big named trainers had winners at big betting odds, and we would expect this to continue.
You should especially take note of these bigger priced runners when a top trainer has dual entries in a race and or when the big priced runner is entered in a valuable race at a Grade 1 track.
76. Two-Year-Old Strategy, Backing the most expensive horse
Until a horse has run no one truly knows their capabilities.
If you are backing a bunch of unraced 2-year-olds then look at their cost price, this can give an indication of what the seller and the buyer thought of the horse.
The more expensive horses tend to come from the more expensive breeding lines and the price can give pointers to its offspring's ability.
77. Two-Year-Old strategy - A helping Hand
The very youngest horses on our racetracks need all the help they can get for what is quite an experience for them. This strategy identifies how horses like this can hugely benefit from the advantage of the running rail.
I have a theory about tracks with large draw bias & 2 yr olds.
Younger horses often need a rail or a strong bias to help them & with there being such a strong bias towards those drawn low at Chester, I wondered how profitable looking at big fields at Chester for 2 yr olds.
At a very basic level, I looked at a 2 yr old race with 10 or more runners since 2003 [-2020].
Betting stall 1 blind in 2yo races over any trip, provided 12 wins from 59 races, a 20% strike rate for +27pts profit
Make that 10+ runners in handicaps and we have 7 winners from 15 races for 46% strike rate and +35LSP
78. Systems based on Blinkers and headgear
...especially when fitted for the first time was researched by an OLBG blogger in his excellent article on blinkers.
It makes sense that trainers will use all legal additions to give their horse the best chance of winning.
All horses like humans have different personalities and if a trainer notices that his particular charge may benefit from blinkers then they will be fitted.
The information passed to the trainer from the jockey may also alert the trainer that blinkers could be a good move.
The main use for blinkers is getting the horse to focus on the ground in front of him or her.
Being distracted can slow the horse and if a win is going to be achieved the horse needs to run in the straight line possible from start to finish.
Take note especially when it is 1st-time blinkers for the horse, the fitting can instantly reap dividends.
79. Spotting the improver after a wind op:
Wind operations are a surgical procedure that is designed to assist with the horses breathing in races.
The notification on race cards of a horse that had received a wind operation was made available from January 2018.
There had been a call from punters that this information was helpful to know especially as it seemed that wind operations had made a difference to a horse's performance.
Trainers were often quoted after a winner and regularly mentioned “ that we gave the horse a wind op”
The jury is out as to how relevant wind operation details are to horses' performance, but we suppose that the more information at our disposal the better.
The Racing Post undertook a survey of readers just prior to the introduction and found that 55% of voters were in favour of the new notification.
More data is required to definitively see the benefits but it currently does not look to cause any harm.
The letters WS next to the horse's name will alert the punter that the specific horse has had the procedure.
80. Using flat handicap ratings to predict juvenile hurdle races
Many horses convert from flat racing to hurdle racing.
Until they jump a hurdle no one is completely sure as to how the animal will take to National Hunt racing, one metric punters use is how highly they were rated on the flat.
A rule many use is that you should allow around 40Lbs, so if a horse is rated 65 on the flat this has him running to a mark of around 105. The rule is nowhere near foolproof but allows you to rate the race in some way.
If you have a juvenile hurdle race packed with ex flat horses then why not try that rule and see if the idea works.
If there are hurdlers in the race who already have an official mark you can rate the race around that mark, here is an example of an October 2019 Fakenham Juvenile Hurdle result, where one runner Local Affair had already been given a mark of 102, but all the other runners had no rating.
Local Affair was beaten by 16 lengths into 3rd, the first Midnight Gift and the second Break The Rules you could rate around the 115 mark such was the ease of their beating of Local Affair.
Midnight Gift won next time out at Aintree and was then awarded a mark of 124, he finished the season rated 133 at the Cheltenham Festival. Break The Rules mixed flat and hurdles on its next few runs and ended the season rated 112.
Local Affair finished the season on 107 so not much difference between its Fakenham run and its initial mark.
So you can see that Fakenham Juvenile Hurdle had horses who were well clear of Local Affair and had you spotted an 80 rated flat horse (Midnight Gift) who was ideal for hurdles you could have profited.
Members have discussed this over the years and found angles to profit.
81. False gambles
We all like a gamble and putting one over the bookmakers, but how do you tell these days what is a genuine gamble from a false gamble?
- Bookmaker False Gambles
- Trainer/Owner False Gambles
- Tipster Gambles
You should always investigate the odds across a range of bookmakers and have as many individual bookmaker accounts, this will give you a better idea of which firms are shortening the prices of the gamble, and allow you if you wish to get on the gamble.
The bookies have a lot of information available to them + the resources to act on this information. They also err on the cautious side so will cut a horse's price even if there is little evidence of a sustained gamble.
If they want to confuse the punter they can deliberately “muddy” the prices making it difficult for us to get a handle on the market.
If we take an 8 runner race with an odds on favourite, then the bookies know the majority of bets will go on that favourite, and the information they have is that the odds on fav is burning up the gallops.
They have little room for manoeuvre and could lose money if the favourite is continuously backed. But what happens if they start shortening a number of other runners, could this distribute the bets more evenly ?
Will social media start talking about the second favourite being backed? All this puts doubts in the minds of punters and you now start wondering if the odds on fav is really such a good thing?
The info they have is that the second fav is average at best but by shortening the price they have diverted some betting cash to that runner, so this gamble is false!
Trainer and Owner False Gambles
We know many stables are regarded as “gambling stables” they like to find winners for their owners so that those owners keep having horses with them. They want to keep the odds as high as possible so their owners can make the most money.
If their horse is put in higher grade races and gambled on, the trainer and owner support the horse and talk it up, but know that it is out of its depth, the gamble loses!
This can happen a few times before they find the perfect race for their horse and having run poorly in its previous race the betting odds will be more generous.
Careful study of trainer patterns should be undertaken, so you know which trainers are known for this.
Two runners from the same stable
This is a bugbear of many of us. There is nothing to stop trainers entering 2 or more runners in the same race. They can use diversionary tactics to make sure that the “better runner” is not supported and the weaker horse is gambled on, the gamble trails in last whilst the weaker runner hoses up.
Paid For Tipster False Gambles
The same principle can apply to high profile tipsters, although I would say many tipsters do try and assist its subscribers. The dodgy tipster can relay info on a horse that is disingenuous, the horse is gambled on, allowing the main bet to start at a bigger price.
82. Using Odds Comparison
A detailed summary of “How To Use Odds Comparison” is available on OLBG with monthly best bookies odds depending on the sport that you like to bet on.
Below we highlight some of the most popular ways punters take advantage of having all the odds in one place.
a) Arbitrage
Arbing is the simultaneous trading of two selections, it differs from trading as with arbitrage both bets are placed at the same time with the sole intention of taking advantage of the different prices currently on offer. OLBG member Davidg3907 covered this subject in a very informative arbitrage blog
Darts, Snooker and Tennis where there can only ever be one winner (no draws) are ideal sports for arbing.
b) Trading
Again a check of an odds comparison site will alert you to any trading opportunities.
You could back an outsider at say 16/1 (17.0) with a bookmaker and lay the same selection on an exchange if the price was shorter on the exchange.
c) Dutching
Similar to arbitrage but here you can back multiple selections with the sole intention of profiting if one of your selections wins.
This can work very well with Ante Post betting where a market is priced up with a lot of selections and by backing say 2, 3, or more selections, if any of them win you win.
83. Going - the most important factor?
The “going” is the word given to the racecourse ground on that particular day.
Each Clerk of the Course measures the “going” using a going stick and relays this information to racegoers, trainers, jockeys, journalists, and any other interested parties.
- Firm
- Good To Firm
- Good
- Good To Soft
- Soft
- Heavy
- Yielding
Different horses prefer different types of going and horses that do not get their favoured going can be withdrawn by their trainers. Especially if at the 48-hour declaration stage the going was good to firm, but we then had 48 hours of rain making the ground good to soft.
Some bettors wait until the first couple of races to truly assess the ground and going conditions before risking any bets. The accuracy of the going reports and the reliability of these reports has been discussed numerous times by members.
When looking for winners you need to find a selection that has its optimal ground conditions, a look back through the form book should alert you to the favoured ground conditions for your selection.
84. Horses stepping up in trip
When we were at school most of us were either better at sprint races or long-distance races, well it is the same for horses.
Some horses barely get the minimum distance (5 furlongs) and others need a test of stamina (The Grand National - 4 miles).
It can take a period of time before a horse finds its “ideal distance” so always look out for a horse stepping up in distance, especially if in previous runs it looked to be “running on at the end of the race, even though it may not have won.
Also, look at the pedigree of the horse, was it’s sire or dam successful at longer distances.
Trainer Sir Mark Prescott is an exponent of stepping horses up in distance and securing win after win at the “new distance”.
85. Course & Distance Winners
Researching course and distance winners is a cornerstone for many punters in their quest to find winners.
All C&D winners feature on racecards signified by the letters C&D next to the horse's name.
Course and Distance Winners
Read Now
You can also separate course and distance form, so if a horse has good course form but not won at the distance that can also be taken into your calculations.
Because a horse has won at the track indicates that the particular idiosyncrasies of the track do not unduly hinder, and we know that the horse has won at the distance can cover the distance involved in today's race.
The different UK and Ireland tracks present unique challenges, this is partly what makes domestic racing so hard to solve, however when a horse has shown its mettle at a track we can bet with a touch more confidence, especially if that track is known for its quirks such as Brighton or Chester.
86. Horses who win first time out
I would say that the trainers who get their horses to win first time out should be the recipients of most praise. It is their training regime and the choice of race by the trainer that enabled that horse to pass the post in first place.
Many trainers have a history of producing first time out winners, a form study of those who do should always be undertaken when deciding on your bet.
87. Distance Form
88. Identifying endurance horses
89. Trainers in Form - hot/cold trainers
A trainer's current performance is often highlighted by members via their tips on the horse racing tips pages.
The majority of stables tend to have an optimum time throughout the season when their horses are performing extra well. Wise punters make themselves aware of this spike in form and follow their horses until this spike levels out.
You often hear commentators saying “the trainer could win with the stable cat” such is their stellar performance in recent days.
However, there could also be something of us reading too much into a trainer's horses winning well and the sporting Hot Hand Fallacy needs to be a consideration.
Likewise, when a stable is COLD, you do need to dig deeper as to the exact nature of COLD form as there could be extenuating circumstances as to why that trainer features.
All trainers who cannot buy a winner do everything to get themselves off the cold list, as owners can lose patience and remove horses from a cold trainer, as well as no trainer wants to be reminded via a published list of their horses running badly
In conclusion, if a trainer's horses are running well look at their entries more closely, likewise if their horses are running badly your betting stakes on their runners should be lowered or avoided completely
90. Trainers who win with their horses first time out/after a break
91. Trainers who need several runs before a win
On the reverse of first-time-out winners are trainers who go more cautiously with their animals, slowly gearing the horses to win a valuable race down the line.
Different horses “come to hand” each season at a variety of times with some needing more time and training than others.
The trainer wants to get experience into his horse so he enters the animal without any expectation of winning the race.
He is not allowed to “school” the horse in a race but can justifiably give the horse runs to garner this experience.
If we use the learning to drive analogy some get behind the wheel confidently and pass their test after the minimum of lessons, others need to take their driving test 2 or 3 times before being able to remove their L Plates.
92. Trainers by past race success 10 year trends
10 year trends has become a popular measure used by many horse racing tipsters.
In the OLBG blogs section you can view a range of races covered in this way.
You can use as many trend categories as you wish, we have listed some of the most commonly used trends below.
- Age
- Weight
- Draw
- Trainer
- Jockey
- Breeding
- Odds
If a trainer has more than one win in the specific trend race then this can be an indicator that they target the race.
93. Using Trainer Comments & Stable Tours
It is important to listen and take in as much information if you are going to regularly find winners. Much of this info can come from trainers via stable tours and when the trainer is interviewed in the press or on TV.
Future winners can be highlighted by the trainer especially those trainers who are more effusive, the trainer knows most about their horses so are always worth a listen. If you miss the interview many stable tours are featured on YouTube.
Just as important are the quotes trainers give their horses both pre and post race. Future winners can be found as long as you keep your ears open to any nuggets of info that the trainer imparts.
94. Connections favourite races
The word “connections” is used predominantly for owners although can encompass trainers, jockeys, stable staff.
Imagine you are lucky enough to own a horse you may like to win at a particular track, or on a bank holiday when more of your friends can come to the meeting and share your enjoyment. Or if you have won a specific race previously then you may aim your horse at the same race the following year.
Always take note of connections to see if there is a pattern of behaviour in relation to races, remember we are all creatures of habit!
95. Spotting significant jockey bookings
I remember wondering why Frankie Dettori in the mid 2000’s was schlepping up to Pontefract on a Sunday to ride in a couple of average races.
Most of us like a Sunday off especially those with families and I thought his journey was significant, well it was as he came away with 2 winners.
Jockey bookings should always be considered, a trainer often knows when his horses are pitched into the ideal race and naturally want the “best jockey” for their horse, especially if said jockey is a rare booking for the trainer.
When a trainer has runners dotted around the country on the same day look which meeting his regular jockey is at, and then look at which jockeys are booked for his other runners.
Look at the % success rate of the jockey and trainer, anything above 25% should be noted, anything above 33% is significant.
Check if the trainer has booked a claiming jockey in a handicap, claimers are engaged when the trainer wants to take weight off the horses back, thus giving it a better chance “at the weights”
The OLBG tipsters often highlight significant jockey bookings in the OLBG tipping competition, so always check out their summary on a race.
96. Unlucky Losers
If you have been betting for a certain period of time then you will know all about unlucky losers, we have all suffered from them.
However, always remember that just because a selection lost it wasn't always unlucky, just a poor selection by you in that race.
But If you do spot what you consider a genuine unlucky loser whilst watching the race then make a note of that horse as you could profit on its next run.
The horse could have been hampered, the jockey may have given the horse a poor ride, the jockey may have dropped his whip at a crucial stage, the horse may have slipped, or made a mess of a particular fence, listen to what the commentator says after the race, does he agree with your visual take on the race that the horse was an unlucky loser?
Keeping a notebook or spreadsheet of horses to follow is crucial these days with so much racing taking place, add a column or page for unlucky losers.
97. Consistently placed horses
If a horse has not yet won and has form figures along the lines of 2,4,3,2 3, 4 many will consider avoiding this horse because it just doesn't seem to win! The horse may get negative comments from racing pundits and presenters further reinforcing that the horse is a bit of a dodge pot.
However, the shrewd punter needs to look deeper into the form and let's say those places came in competitive big field handicaps such as those below.
- 4/12 at Newmarket Guineas Meeting
- 2/17 at Royal Ascot
- 3/12 Group 3 Haydock
- 2/12 Sandown (from a poor draw)
- 3/16 Lingfield (All Weather)
- 4/22 Newmarket
The above means that the consistently placed horse beat over 70 horses at Grade 1 tracks, this is form not to be sniffed at or ignored.
98. How good was the horse that won
When Frankel was blowing away all his main rivals in his imperious manner the horses that finished behind him were often forgotten about. However because Frankel was so good any horse that finished with 10 lengths of him put in a decent performance.
As a matter of fact, Frankel only raced 14 times before retiring to stud, but over 40 subsequent winners came from races that Frankel competed in.
You can often rate a race by how good the race was and how good the winner was.
A horse that has put up a string of future wins and moved up the official ratings should be followed, and more importantly, the horses that finished close to that improver should be noted.
99. Using tools Raceform interactive/other stats tools
These days there are a lot of horse racing information services, nearly all do an excellent job pointing you towards winners.
http://www.raceforminteractive.com/
These services let you test out systems, access form, check statistics, and examine in more detail a horse's performance.
With most there is a cost via a monthly or yearly fee and you have to weigh up the value you can get from these services in relation to your betting life.
100.The Ultimate Horse Racing System
Many may claim to have an Ultimate Horse Racing System but we tend to think it is a combination of gleaned knowledge from a variety of sources.
The knowledge will take time for anyone to amass and as the well known Gary Play quote emphasizes
“ The more I work and practice the luckier I seem to get”
Perhaps the ultimate horse racing system would combine many of the factors in this betting school lesson. OLBG members came together to discuss all the important factors when deciding on which bets to place.
101. How important is finding winners if you understand value betting.
Robmull tells a fascinating tale of a colleague who knew nothing about horse racing but managed to make him and his colleagues a profit using a very basic strategy for selections, but a very sophisticated strategy for determining value and staking.
This is a good lesson of how winner finding which we have looked at in the first 100 tips here, is just part of the equation when trying to win at betting.
Just as, if not more, important are other factors listed below, click on each of these to learn more.
FAQ
FAQ
101 Ways To Find Winners In Horse Racing FAQ
-
Read and learn as much as possible to get maximum enjoyment and let the information sink in. On OLBG, we have hundreds of horse racing articles; take a good look around.
-
No one rule will lead to backing a winner in every race.
You need to build a picture of the horse or race you are interested in and use some of the guidelines above to help in your selection process.
-
Test, test and test again; use a spreadsheet to carefully monitor results or add selections in the free to enter OLBG tipping competition.
-
All have been added to aid winner finding; but there are no guarantees.
However some will be more relevant for National Hunt, whilst others are more suitable for Flat Racing.
-
- You can use the contact form at the bottom of any OLBG page.
- You can join the OLBG community on the Discord website.
- You can ask questions via OLBG's Twitter or OLBG's Facebook page.
-
The winner finding advice can be utilised at both the bookmakers and the exchanges.
Responsible Gambling
You should always gamble responsibly, and never spend more than you can afford.
Horse Racing markets are volatile and prices can fluctuate numerous times with horses being backed and drifting.