
With hundreds of different betting sites, finding the best can be confusing. I'll guide you through and find the most suitable bookie for you.
The best NBA betting sites have to be selected from a list that is in excess of 60 individual online bookmakers. How do you find the best one? Rely on the team of betting experts at OLBG to do the research and comparison and come up with the top 10 basketball betting sites for you to back up your basketball tips with bets. We also have a full list on welcome offers and free bets.
Slam Dunking the Best Basketball Betting Sites 🏀📊🏆
| Event Coverage | Markets | Odds | In-Play | EW Outrights | Stats | Promotions | Live Streaming | Total | |
|---|---|---|---|---|---|---|---|---|---|
| 888Sport | 5.0 | 5.0 | 4.0 | 1.0 | 1.0 | 3.0 | 1.0 | 0.0 | 20.0 |
| QuinnBet | 5.0 | 3.0 | 4.0 | 1.0 | 1.0 | 3.0 | 2.0 | 0.0 | 19.0 |
| bet365 | 5.0 | 4.0 | 4.0 | 1.0 | 1.0 | 0.0 | 2.0 | 1.0 | 18.0 |
| Spreadex | 5.0 | 5.0 | 4.0 | 1.0 | 0.0 | 3.0 | 0.0 | 0.0 | 18.0 |
| LiveScore Bet | 5.0 | 5.0 | 5.0 | 1.0 | 1.0 | 0.0 | 1.0 | 0.0 | 18.0 |
| Boylesports | 4.0 | 4.0 | 4.0 | 1.0 | 1.0 | 2.0 | 1.0 | 0.0 | 17.0 |
| Parimatch | 5.0 | 5.0 | 3.0 | 1.0 | 1.0 | 2.0 | 0.0 | 0.0 | 17.0 |
| Ladbrokes | 4.0 | 4.0 | 5.0 | 1.0 | 0.0 | 0.0 | 2.0 | 0.0 | 16.0 |
| Unibet | 3.0 | 5.0 | 5.0 | 1.0 | 0.0 | 0.0 | 2.0 | 0.0 | 16.0 |
| 10Bet | 5.0 | 5.0 | 3.0 | 1.0 | 0.0 | 2.0 | 0.0 | 0.0 | 16.0 |
| Betway | 5.0 | 4.0 | 4.0 | 1.0 | 0.0 | 2.0 | 0.0 | 0.0 | 16.0 |
Top 10 Basketball Betting Sites In Detail
Welcome Offers for the Best UK Basketball Sites
Here are the sign up offers for the best sites – some are household names, others less well-known and may be new brands to you. After that, we'll go into detail on why they score so highly and which bettors they suit.
- Min Deposit £5
- Min Odds 1.5
- Offer amount -
#ad. 18+, gambleaware.org, T&Cs Apply
- Min Deposit £10
- Min Odds 2
- Offer amount £30
#ad. 18+, gambleaware.org, T&Cs Apply
- Min Deposit £10
- Min Odds 2
- Offer amount £20
#ad. 18+, gambleaware.org, T&Cs Apply
- Min Deposit £10
- Min Odds 1.5
- Offer amount -
#ad. 18+, gambleaware.org, T&Cs Apply
Top Basketball Betting Sites and Why
To expand upon the data presented at the top of this page, we delve deeper and explain the factors contributing to these bookmakers qualifying as the best for basketball betting fans.
bet365
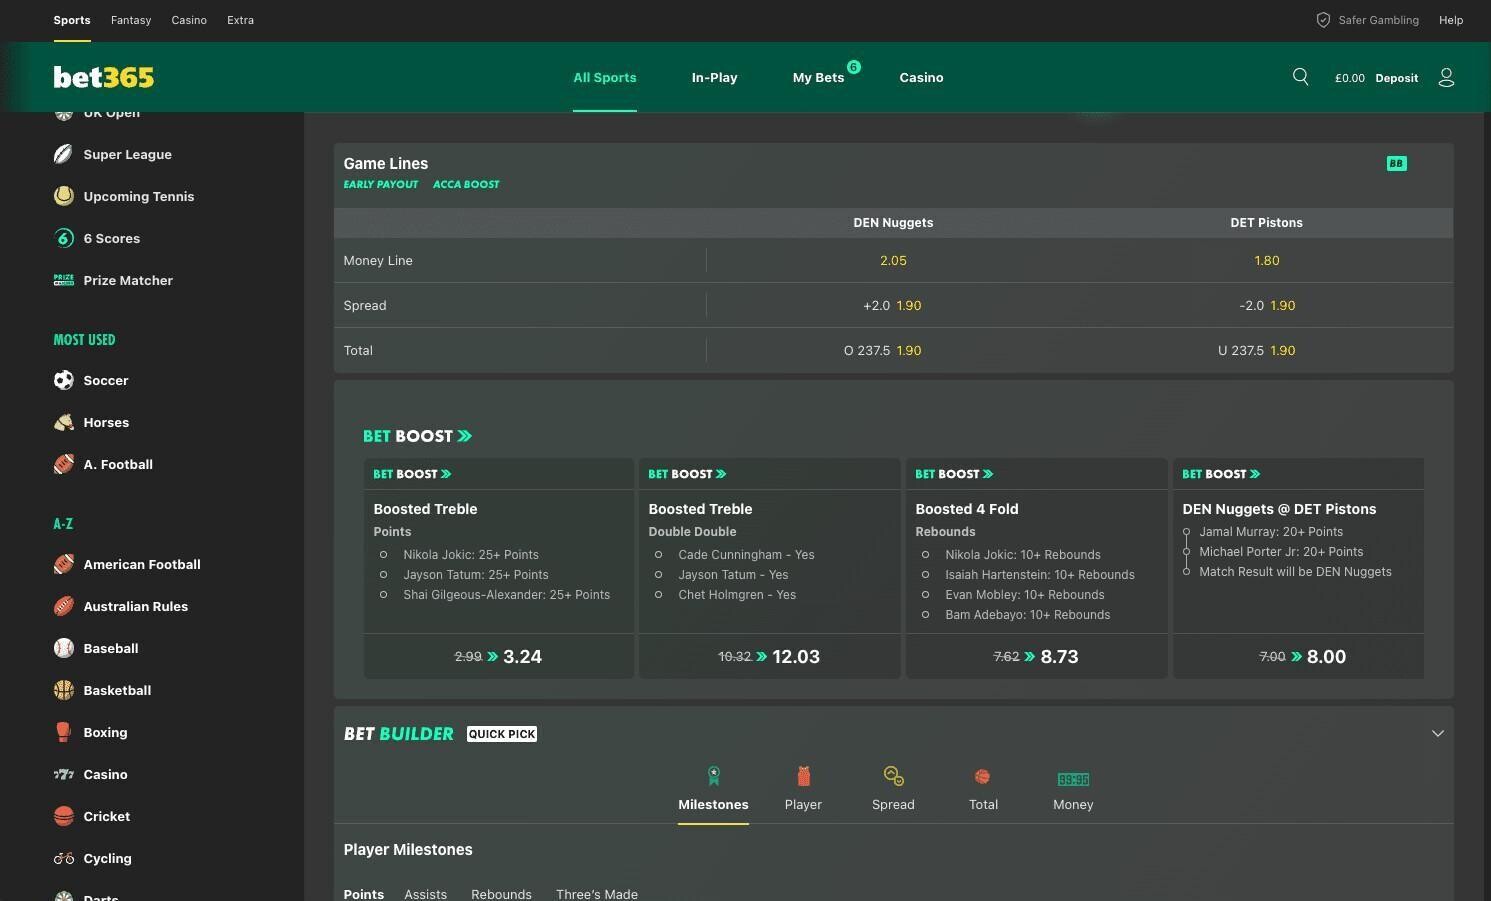
You'll find some of the best odds for basketball at bet365, with value not a million miles of exchange sites. As with most sports, bet365 has huge event coverage, but one the key points of difference that sets bet365 apart from the rest is the number of odds boosts that you get on basketball markets, plus early pay out on plenty of games when your team goes 20 points up. Factor in live streaming on certain events and a great stats package and you have a very good betting product.
Pros
- Lots of odds boosts and promos
- Early pay out on basketball games.
- Fantastic odds.
Cons
- Number or markets not as much as top three sites.
Unibet
Few UK bookmakers can match Unibet when talking about the best basketball betting sites. For those interested in doing a little line shopping, Unibet’s basketball odds are unrivalled, comfortably offering the best, while also being among the top four or five bookmakers for markets offered. Not only can you also create your own bet builders on basketball games, there are supporting statistics on screen to help inform your decision. Unibet is a brilliant option.
Pros
- Incredible odds
- Enormous range of markets available
- Huge event coverage
Cons
- Next to nothing when it comes to promotions
Netbet
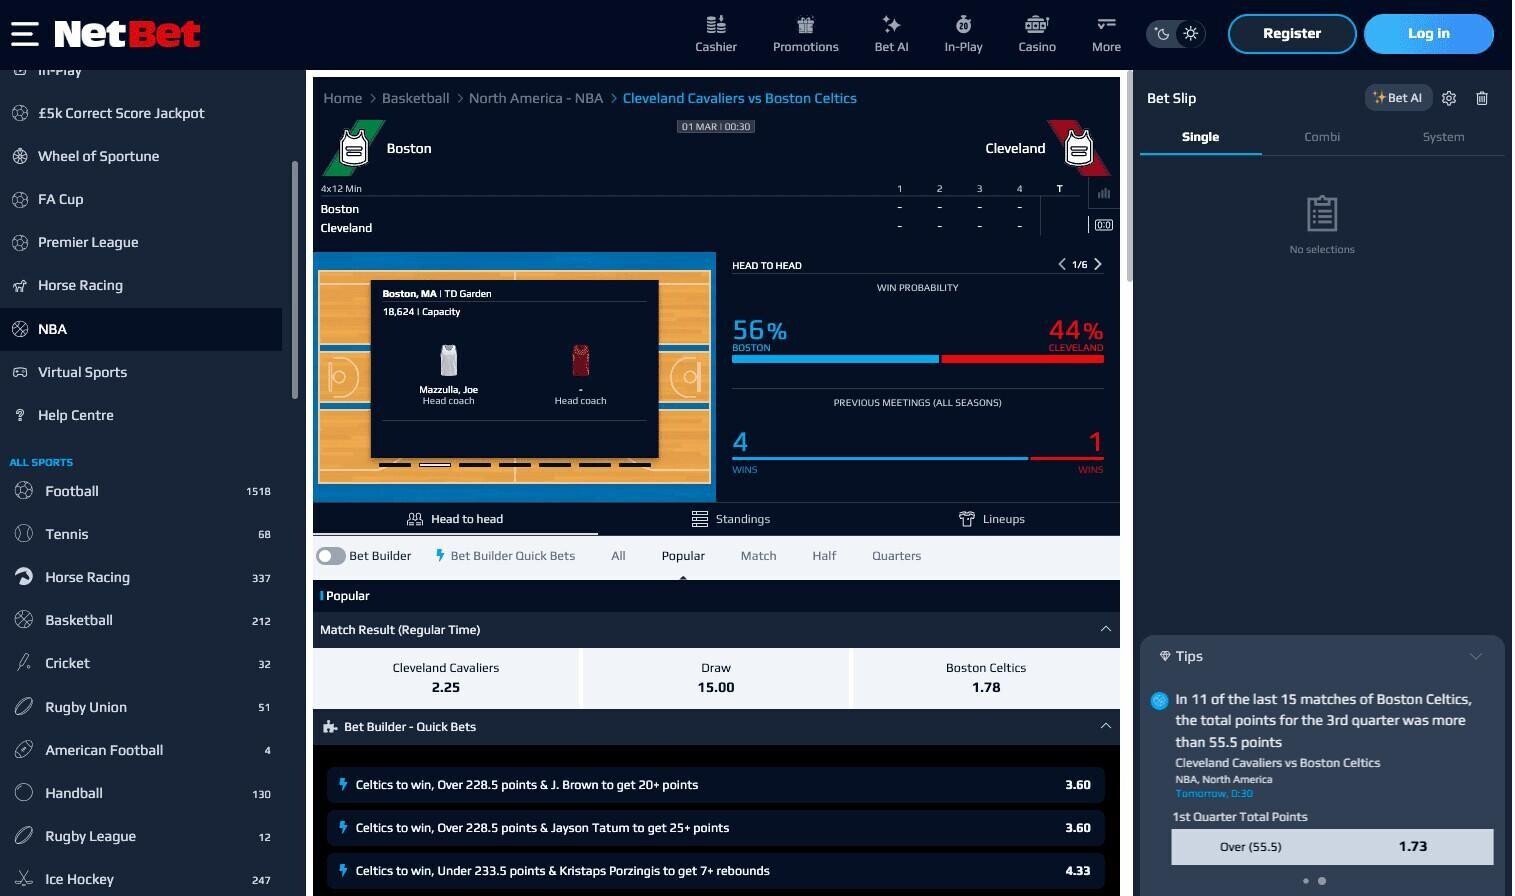
Just pipped to third spot, Netbet’s basketball offering is fantastic. For NBA betting sites, only Unibet can best this impressive service. Netbet can match Unibet for markets and bet builders, while its statistics and graphics propel it ahead of most. The only real difference is that NetBet can’t quite compete when it comes to odds. That said, there will be plenty who prefer its interface – just depends what you’re after. Also, when you bet £25 or more you get a free £5 bet.
Pros
- The best basketball statistics in the UK
- Brilliant event coverage
- Amazing range of markets per game
Cons
- Odds aren't as good as most in the top ten
- No live streaming
888Sport
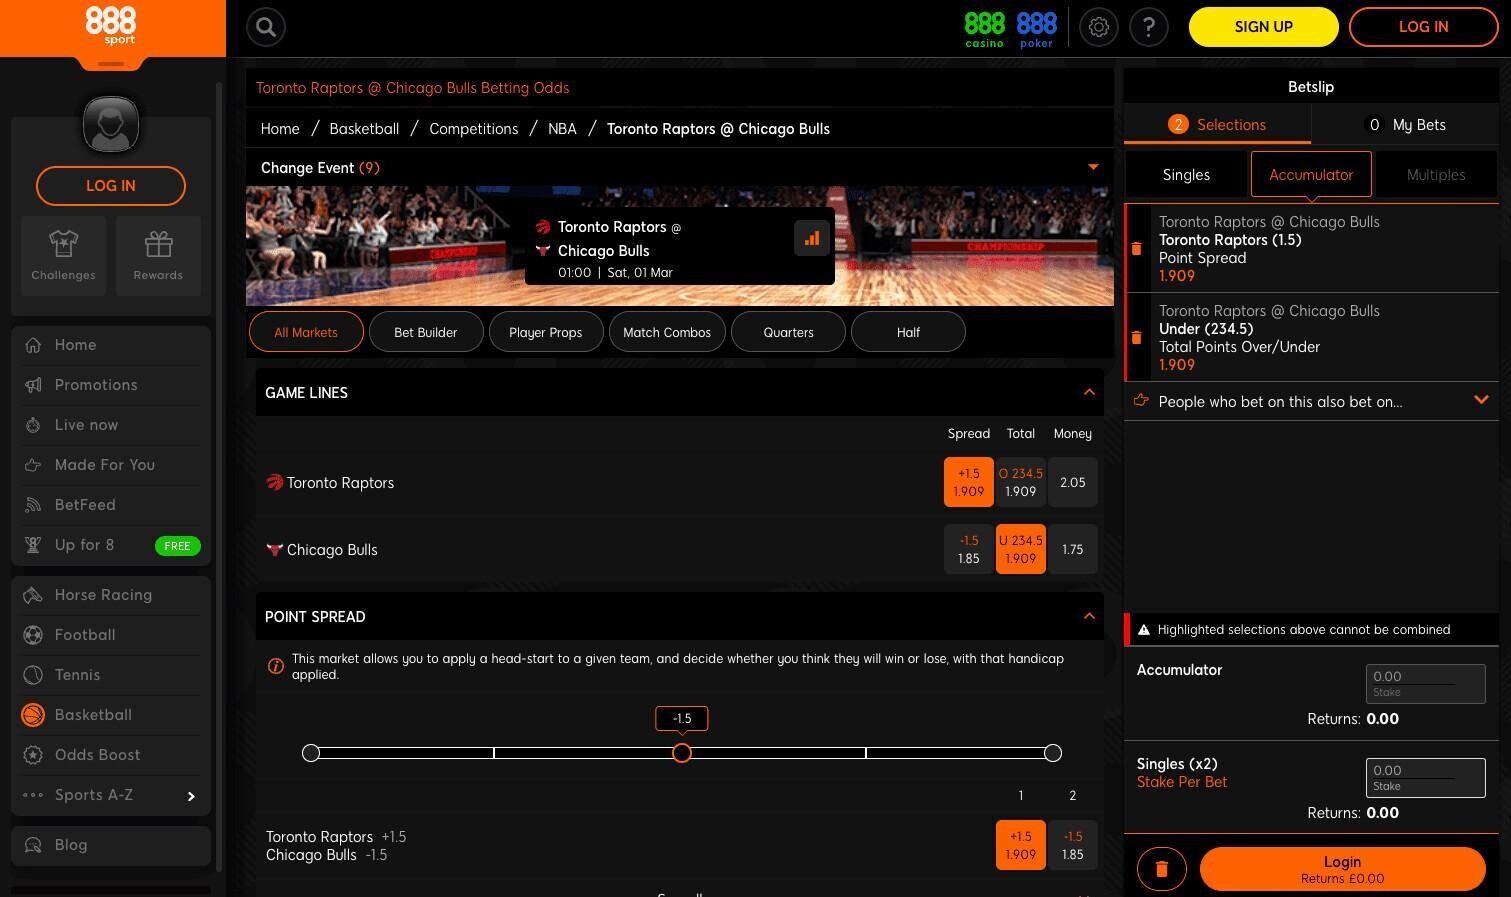
888Sport is probably the best UK sportsbook for basketball promotions. There are regular promos throughout the NBA season, with punters available to get free bets when staking certain amounts on basketball markets. Across the board the odds are really good, there's a decent live streaming package and there are plenty of competitions around the world covered.
Pros
- The no.1 bookie for basketball promotions
- Above average event coverage
- Great odds
Cons
- Not as many markets per game as some of the other bookies in this list
William Hill
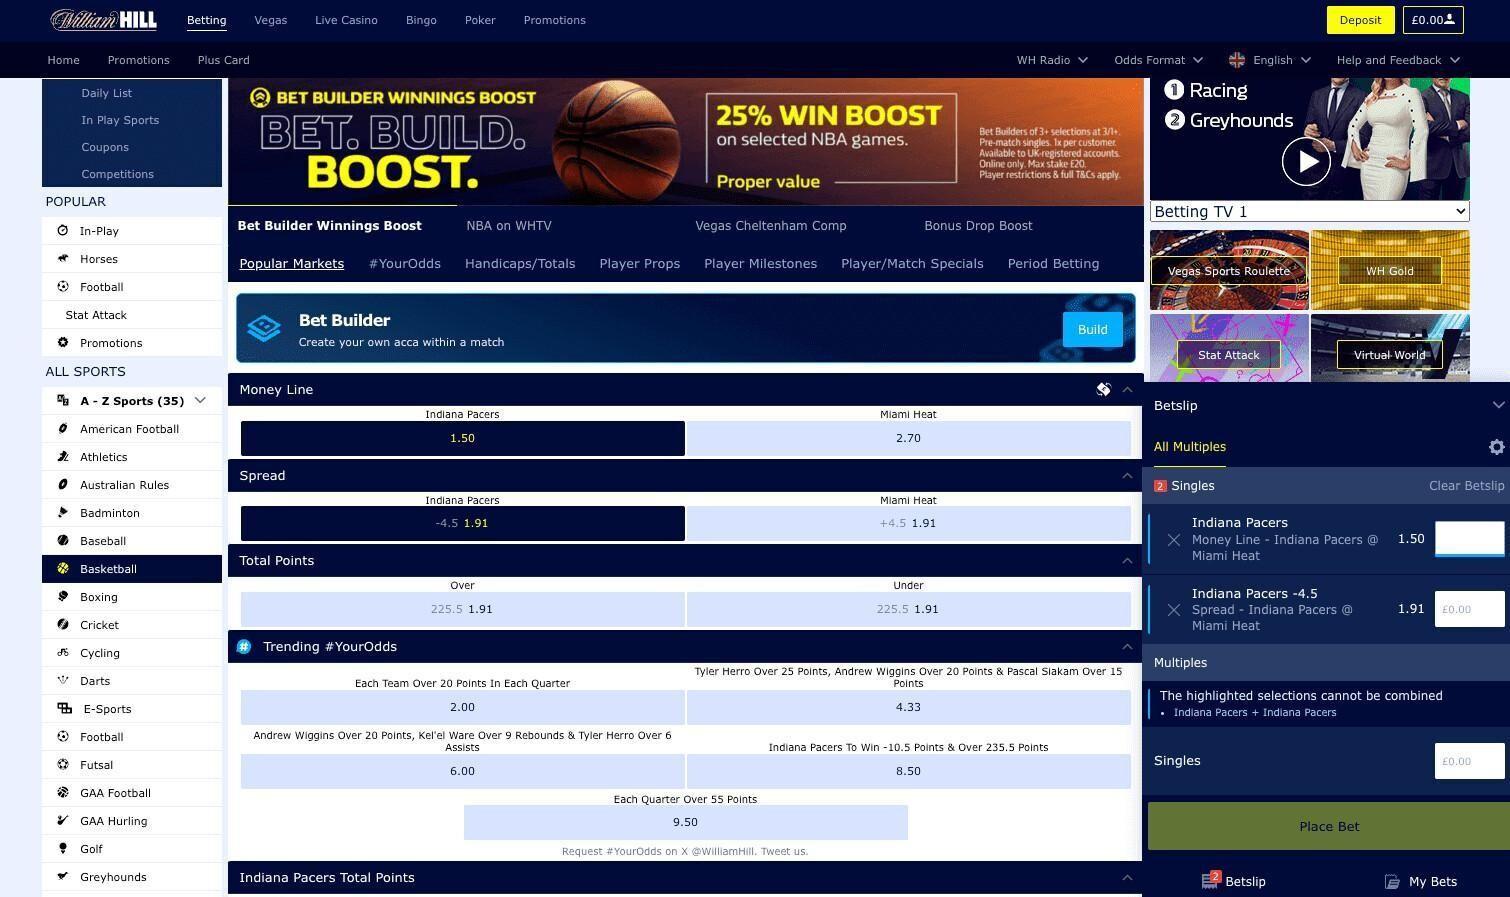
William Hill is probably the best bookie for streaming basketball, thanks to its WHTV service that you can watch as a signed-up customer. After that, William Hill is consistently great across all aspects – that goes for odds, event coverage, markets and promotions. The William Hill site can be a little messy at times, but don't let that detract you from the excellent content.
Pros
- Brilliant live streaming options
- Consistent across the board in most aspects
- Decent number of promotions
Cons
- Nothing in the way of stats to support betting
Vbet

Close to rounding off the list for basketball betting sites in the UK is Vbet. Vbet is gradually carving out a reputation for offering elite services in some categories. Across our research they’ve topped a few tables and consistently score highly. Their basketball service is brilliant, especially their bet builder, which offers cash out on all custom bets. They cover all the Euro basketball leagues (think France, Germany, Italy and Spain) as well those in Asia, and on top of that, women’s basketball, too, which very few basketball betting sites do.
Pros
- The best UK bookie for number of markets offered
- Amazing event coverage around the world
Cons
- No live streaming
- No basketball stats
One more thing to consider...
Parimatch don't quite make our top 10 for basketball betting sites, and that's down to an overall score, taking all things into account. That said, they do a brilliant offer, exclusively aimed at the NBA. It can be quite difficult to find sports-specific offers away from football, horse racing and the big markets, so having an NBA one is definitely worth shouting about. It's a chance to bet on basketball, while doubling your stake, and even getting some casino spins thrown in for good measure.
How We Score Basketball Betting Sites
The scoring to establish the best basketball betting sites was collated by our team of betting experts, who poured over every available UK online betting site to assess various factors keeping in mind the most important. Those being - ODDS, MARKETS, and PROMOTIONS
Hours of research went into analysing no fewer than 100 individual bookmakers to ascertain which should be the best for betting on basketball and the NBA.
🏀 Basketball Betting Odds
The first place to start is a bookmaker that offers great basketball odds in comparison against other bookmakers is going to have a good score. When all is said and done value is King, and good odds are absolute must.
📈 Market Depth
With many one-sided affairs contributing to very short money line odds for favourites, we wanted to check out the spreads and lines and go beyond to see what proposition bets might be available on top line games, in the NBA, European league and international tournaments.
🎁 Promotions/Bet Builders
A great benefit to regular basketball punters is the availability of promotions, either for specific games or regular season-long promotions like the ever-popular Bet Builders. We picked out every bookie that offered same game multis in Bet Builder formats, and coupled that with those giving the best odds to extract the maximum possible value
📊 Statistics
Finally, although not heavily weighted for scoring purposes, we checked and noted each betting site that had access to statistics in either pre-match format, or also match tracking in play stats for those that like to have a bet once the action has begun.
Best Basketball Betting Site for Odds
There were four clear stand outs for basketball betting odds. bet365, Betway and Unibet are well known names, but the quad was completed by the probably lesser known BetUK, who you might want to consider next time you are betting on the NBA.
The High Scorers in NBA Basketball Betting Odds 🏀🌟💰
- Min Deposit £10
- Min Odds 1.8
- Offer amount £40
#ad. 18+, gambleaware.org, T&Cs Apply
Best Basketball Betting Site for Markets
Beyond the one-sided moneyline betting options, we took some considerable time to check all basketball leagues and matches offered by each bookmaker to find who offers the greatest range of betting markets on a single game.
If niche betting angles on basketball are what you are looking for, perhaps come of these fresh betting site names might interest you and be worth checking out.
Unveiling the Underdogs: Key Players in Niche Basketball Betting Markets 🏀🎲🔍
Best Basketball Betting Site for Promotions
Bet Builders are one of the most popular promotions, primarily used in football betting, but these betting sites also offer the option on selected basketball games too adding another aspect to get them into the list of best NBA betting sites. Coupled with the best odds data from earlier, bet365, BetUK and Unibet are the standout option for those big odds speculative bet builder options for basketball.
| Betting Site | Build a Bet | Odds |
|---|---|---|
| bet365 | ✅ | ⭐⭐⭐⭐⭐ |
| BetUK | ✅ | ⭐⭐⭐⭐⭐ |
| Unibet | ✅ | ⭐⭐⭐⭐⭐ |
| 32Red | ✅ | ⭐⭐⭐ |
| 888Sport | ✅ | ⭐⭐⭐ |
| All British Sports | ✅ | ⭐⭐⭐ |
Power Players in Bet Building for Basketball: Odds, Options, and Opportunities 🏀📈🎯
- Min Deposit £5
- Min Odds 1.5
- Offer amount -
#ad. 18+, gambleaware.org, T&Cs Apply
Best Basketball Betting Site for Statistics
There are several great sites out there for researching basketball bets and included among those are some of UK bookmakers.
These bookies offer some very good stats packages making the transition from research to placing your bet easy, and putting them among the best NBA betting sites in the UK. The following is a selection of bookmakers who have basketball stats on their websites:
- Min Deposit £10
- Min Odds 2
- Offer amount £15
#ad. 18+, gambleaware.org, T&Cs Apply
Best Basketball Betting Site for Live Streaming
Basketball is one of the best-covered sports when it comes to live streaming on bookmaker websites. Several of the top NBA betting sites offer streaming across a variety of leagues. Below are a selection of the UK bookmakers who offer this service:
- Bet365
- Betfred
- William Hill
- Coral
bet365 Live Streaming Terms
How OLBG Reviews and Rates Basketball Betting Sites
Are you looking for the perfect basketball betting site? At OLBG, we've meticulously crafted an editorial process that ensures each review is thorough and reliable. Our comprehensive assessment involves a team of seasoned reviewers and dozens of regular sports bettors, dedicating a minimum of a month to each review. Here's an inside look at our review and rating policy, tailored to help you find the best basketball betting sites.
Detailed Review Process
Our experienced in-house writers spend at least two weeks evaluating each betting site. They place at least ten bets, testing various sports, markets, and features. With over a decade of online betting experience, our reviewers provide insightful comparisons with personal experiences across multiple platforms.
Key Factors We Assess:
- Customer Support: Prompt and helpful interactions.
- Banking & Payment Options: Variety and ease of transactions.
- Site Usability & Mobile Experience: User-friendly interface on both desktop and mobile.
- Range of Basketball Markets Covered: Comprehensive basketball coverage.
- Types of Bets Accepted: Various options including antepost betting.
- Odds Offered: Competitive odds for basketball.
- Promotions & Offers: Attractive bonuses and ongoing basketball promotions.
- Initial Bonus Terms: Fair and transparent conditions.
- User Experience: Pleasant and hassle-free betting environment.
- Ease of Registration & Account Verification: Simple and straightforward processes.
- Live Streaming & In-Play Betting: Quality streaming and live basketball betting options.
- Maximum Payouts: High limits for potential winnings.
Comprehensive Rating System
In the third and fourth weeks, our review panel rigorously tests each basketball betting site, providing a rating out of 5 stars. They review the initial evaluation, offering additional feedback and insights. This collaborative effort ensures a well-rounded and accurate review, enriched by diverse basketball betting preferences and experiences.
OLBG Members’ Feedback
Once the core review is complete, OLBG members who regularly bet on basketball are invited to try out the site and share their ratings and feedback. This community-based evaluation brings a practical perspective, highlighting real user experiences and preferences.
Real User Reviews
We aggregate reviews and ratings from regular sports bettors, allowing you to compare and determine the best basketball betting sites for you. Reading through these genuine user experiences provides peer-to-peer endorsement.
User Ratings
Our members rate each bookmaker out of 5, contributing to an extensive database of reviews. For instance, bet365, with over 1,000 ratings, holds an impressive 4.4/5 score. You can explore individual reviews to understand why it’s a top choice among basketball bettors.
We publish these reviews unedited (excluding content with swearing, potential libel, or specific disputes) to maintain transparency. For specific disputes, we advise direct communication with the bookmaker or consulting IBAS (Independent Betting Adjudication Service).
Staying Current
We constantly update our reviews, incorporating new feedback and significant changes to ensure they reflect the latest information. Major updates, like a site redesign or new sport additions, trigger a full reassessment, providing you with the most current and accurate data.
Comprehensive Comparison
We offer detailed comparison guides highlighting the best sites for different sports and bet types. This thorough comparison allows our review team to identify top performers and under performers, making your selection process easier.
Why a basketball bookmaker may achieve a high rating at OLBG
- Competitive basketball odds
- User-friendly site and mobile app
- Attractive bonuses and ongoing basketball offers
- Excellent live streaming and event coverage
- Top-notch customer service
- Robust in-play basketball betting opportunities
- Early market pricing
- No restrictions on winning accounts
Why online bookmakers are rated poorly by OLBG
- Confusing initial offers
- Difficult site navigation
- Lack of ongoing basketball bonuses
- Poor odds
- Limited basketball event coverage
- Inefficient customer service
- Early betting limits
- Transaction charges
Trusted by Many
OLBG boasts an industry-leading Trustpilot rating of 4.6 from over 800 reviews. Check out our Trustpilot reviews to see why we are a trusted source for betting site reviews.
Ready to find the best basketball betting site? Trust OLBG's rigorous review process and extensive user feedback to guide your choice.
Advantages of Considering a New UKGC-Licensed Bookmaker
Exploring new UKGC-licensed betting sites can offer a range of benefits that shouldn’t be overlooked. A fresh bookmaker provides an excellent opportunity to start with a clean slate, and a fresh approach to a specific sport, odds and features that are tailored to your betting style
Switching to a newly-licensed bookmaker introduces you to new welcome bonuses and promotional offers unavailable at sites you may already be registered with. new betting operators often attempt to differentiate themselves through innovative features, alternative market selections, and competitive odds.
Pros
- Latest tech: live streaming, cash-out, mobile.
- Generous welcome offers, free bets, promotions.
- Clean, modern design and a fresh look.
Cons
- Unproven track record; check license/regulation.
- Fewer markets than established betting sites.
- Limited customer support, slower problem resolution.
How To Choose The Best Basketball Betting Site For You
If you're on the hunt for a new basketball betting site, there are several crucial elements you should consider to ensure a top-notch betting experience:
Key Factors to Evaluate:
- Trustworthy
- Reliable
- Low Risk
- Reputable
- Player Friendly With Their Terms and Conditions
- Everything Else You Want!
🔒 Trustworthy
With over 80 online bookmakers licensed in the UK, we only list those vetted by the UK Gambling Commission and good for basketball in our bookmakers guide. Betting with non-licensed bookmakers offering basketball betting can be risky and may lead to complications in case of disputes. For your peace of mind, always check if a betting site holds a valid license through the Gambling Commission website.
Table: Top Trusted Betting Sites (Trustpilot Ratings)
| Online Betting Site | Trustpilot TrustScore | Number of Ratings |
|---|---|---|
| BetGoodwin | 4.0 | 796 |
| Matchbook | 4.2 | 1899 |
| Spreadex | 3.8 | 1106 |
| 10bet | 3.7 | 1157 |
| Netbet | 3.4 | 1849 |
Data correct as of 4/9/2024 - Source: Trustpilot Betting Agencies
✅ Reliable
Not all licensed basketball bookmakers meet our reliability criteria. We exclude those with a track record of pending payments, shifting terms and conditions, and poor customer service. While we highlight these issues in our reviews, the worst offenders don’t make our list.
🟢 Low Risk
Small, new companies in the UK market may pose higher risks due to potential cash flow issues. However, if they are UK Gambling Commission-registered, they must meet financial solvency criteria. Larger, more established companies typically present lower risks. While it's rare for bookmakers to close without honouring bets, choosing established operators for long-term (ante-post) wagers is advisable. Diversifying your bets across multiple bookmakers can also mitigate risk.
🌟 Reputable
Reputation is best gauged through user experiences. We gather over 500 user reviews from the OLBG community to offer detailed insights into various UK betting sites. These reviews cover customer service experiences and how disputes were resolved.
👥 Player-Friendly Terms and Conditions
We meticulously analyse each betting site's terms and conditions, withdrawal policies, and deposit terms. Some sites may impose charges for certain transactions or inactivity, so it's crucial to be well-informed. Our community reviews and research highlight these details to ensure you get fair terms.
Tips for Choosing Your Next Basketball Betting Site:
- Minimum Deposit Requirements: Always check the minimum amount you need to deposit to activate your account.
- Deposit and Withdrawal Methods: Ensure the site supports convenient payment methods for you.
- Withdrawal Policies: Look for any fees associated with withdrawals.
- Betting Rules: Understand the minimum bet amount, maximum winnings, and specific rules for voided bets.
If you're content with your current bookmaker but want a change, or you must provide proof of affordability and are looking for alternatives, we have recommendations for similar sites.
Similar Sites to Your Current Basketball Bookmaker:
- William Hill: Consider Ladbrokes or Betfred for a similar experience.
- Matchbook or Smarkets are great alternatives for betting exchanges; bet365 or BetVictor for fixed odds.
- Ladbrokes: William Hill is a reputable choice.
- bet365: BetVictor offers a similar range of markets and in-play betting.
Our guides and reviews are filled with information to help you choose the best basketball betting site for your needs. If you prefer exploring various sites, take advantage of welcome offers, but always read the terms and conditions.
Join OLBG for free to access comprehensive reviews and share your experiences with other betting enthusiasts.
Summary and Conclusion
When looking for the best bookie for basketball betting, the key areas to consider are:
- ✅ OLBG experts analysis of best basketball betting sites overall and best by the category which you are most interested in.
- 💬 OLBG user reviews to see what regular bettors say about their experiences at each basketball betting site.
- 💳 The payment methods which you want to use and which bookies support them.
- 🔒 How trustworthy, reliable and reputable each bookie is.
Basketball Betting Related Questions
FAQ
Basketball Betting Sites FAQs
-
You can bet on NBA basketball with an online bookmaker in the UK. Just about every bookmaker will list NBA matches during the season as well as college basketball too. Read some reviews of bookmakers to find the best one for basketball betting, as some will be better than others.
-
With basketball taking place year round around the world you can bet on basketball just about any time you want. The NBA in the US is the leading and most popular league for betting, but there are also many leagues in Europe and Australia too. Betting on Colege basketball in America is also popular.
-
The way to bet on basketball is to decide what outcome you want to predict. This could be the match-winner, or maybe how many points you think will be scored by either team or in total. Many bookmakers have a lot of different betting market options for Basketball, especially the NBA in the US.
-
NBA Odds work in the same way as any other sports betting odds you see. Most often you will find decimal odds on display if betting online on basketball in the UK. Simply, explained, you multiply how much you want to bet by the odds on offer for the prediction you are making to work out how much you would be returned if you make a correct prediction
-
You can get NBA tips tonight and throughout the NBA season right here on this page from OLBG's knowledgeable basketball betting tipsters. Our basketball experts add their daily NBA predictions as soon as the games odds become available.
-
Today's best NBA tips on this page are the most popular selections from our basketball betting tipsters , these NBA tips cover the NBA Money Line, NBA Pointspread and Game Totals markets. You can also check our Best Basketball Tipsters for NBA tips tonight, these are NBA predictions from our most profitable experts for basketball betting tips covering the last 12 months.
-
Check out our Best Bookmakers for Basketball Betting Guide to see which bookies are the best to use for your NBA bets. The best basketball betting site guide covers which bookies have the best NBA odds, bookies with the best range of basketball betting markets, the best bookies for Pointspread betting, best bookies for free basketball stats and much more. Take a few minutes to read our informative guide before placing your NBA picks tonight.
-
A good knowledge of the NBA teams and how they are performing in the current season makes it easier when it comes to making NBA betting predictions. If you think a team is going to win the game then you place a Money Line bet, this is a simple straight win bet. If you think the game will be a high tempo NBA game with lots of scoring then you may want to place a bet on the Game Totals market especially if the bookies have set a low total. This is a simple 'Over' bet if you think the combined teams score will be over the total set by the bookies or an 'Under' bet if you think the total is too high. Our experts NBA tips tonight cover these basketball betting markets.
-
This article includes a list of the top ten basketball betting sites in the UK. You can use any of these bookmakers, plus many more, to place bets on basketball when you’re in the UK.
-
Like any other sport it is a matter of finding the markets that you want to bet on and choosing an amount to stake. There are hundreds of different markets to bet on, allowing you to choose the one that suits you.
-
Bookmakers set their own lines. All NBA games will have lines set – you’ll see these on your bookmaker’s display – and it is down to the individual bookmaker to determine what those lines are.
-
The best place to bet on the NBA online, if you’re in the UK, is with Unibet. There are plenty of other great basketball betting sites, but Unibet comes out on top based on our detailed research.
-
Generally, overtime is included in basketball bets. Double check with your bookmaker, but most include overtime as standard for bets such as spread, over/under and moneyline wagers.


