I've spent over 20 years inside the betting industry. I'll guide you to avoid the hype, ignore the noise, and steer clear of the common pitfalls that catch out everyday punters.
Over the past few years, there has been much debate about the UK’s gambling habits, largely due to the fact the government is planning a review of the Gambling Act. Some of the measures rumoured to be forthcoming as part of this review are contentious, particularly the possible introduction of mandatory affordability checks.
With both gambling industry representatives and the anti-gambling lobby – usually with very conflicting views – putting out regular commentary as we await the White Paper that is expected to provide more information on the review, it can be difficult to work out exactly what is going on in the gambling community.
At OLBG we wanted to get an accurate picture of the UK’s gamblers, so we commissioned YouGov to undertake a survey of bettors. We plan to repeat this survey on a yearly basis to track trends among those gambling across the UK.
We believe the results provide valuable insight into the minds of the nation’s bettors and hope you enjoy reading it.
Richard Moffat, CEO, OLBG news@olbg.com
Contents of the PDF
- Introduction
- Current Betting Habits of UK gamblers
- Betting Frequency
- Plans for Gambling in 2023 compared with 2022
- Plans for Betting on Cheltenham in 2023 compared with 2022
- Use of High Street Bookmakers
- Affordability Checks
- Betting terms and conditions
Download The Full Report
The results of this YouGov survey are in - and they're just a few clicks away! No email address or other information is needed; the full report can be accessed instantly by clicking on the provided link.
Methodology
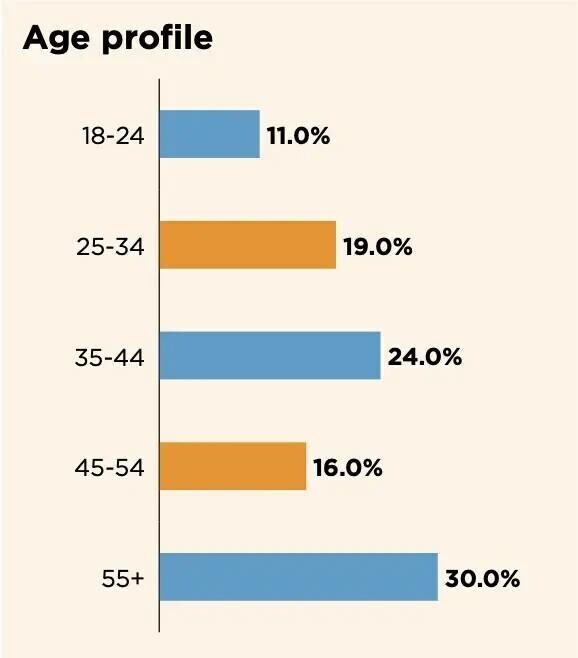
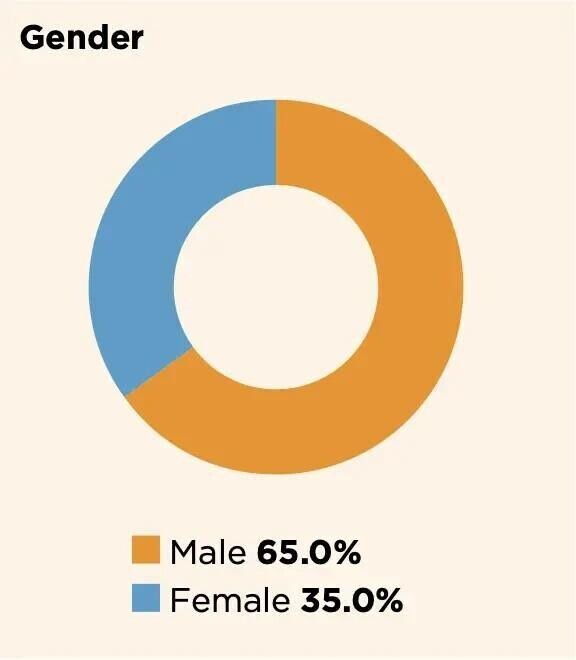
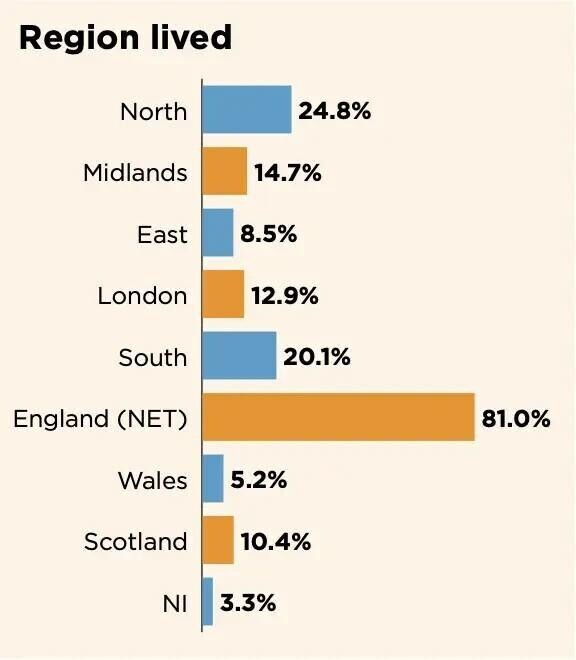
OLBG hired YouGov to carry out the survey. All figures, unless otherwise stated, are from YouGov Plc. Total sample size was 1,007 UK Gamblers. Fieldwork was undertaken between 23rd February-2nd March 2023. The survey was carried out online. The figures have been weighted and represent all UK Gamblers (aged 18+). The following charts show the breakdown of respondents by gender, age and region.


